
Japanese Yen struggles to capitalize on modest gains against USD amid tariff jitters
- The Japanese Yen attracts dip-buyers following a downtick to a one-week low against the USD.
- Bets that the BoJ will hike interest rates further continue to act as a tailwind for the JPY.
- Concerns about Trump's tariff plans cap gains for the JPY and help limit losses for USD/JPY.
The Japanese Yen (JPY) remains on the front foot against its American counterpart heading into the European session on Monday amid hawkish Bank of Japan (BoJ) expectations. Investors have been pricing in the possibility of more interest rate hikes by the BoJ, which remains supportive of elevated Japanese government bond (JGB) yields and continues to underpin the JPY. Apart from this, the emergence of fresh US Dollar (USD) selling fails to assist the USD/JPY pair to capitalize on its intraday uptick to the 151.00 mark, or over a one-week high.
Meanwhile, BoJ Governor Kazuo Ueda warned last week that the uncertainty about US President Donald Trump's tariff plans and their impact on the global economic outlook requires vigilance in setting monetary policy. This is holding back the JPY bulls from placing fresh bets and lending some support to the USD/JPY pair. Investors also seem reluctant and opt to wait for this week's important US macro releases scheduled at the beginning of a new month, starting with the ISM Manufacturing PMI later this Monday, before placing fresh directional bets.
Japanese Yen sticks to its positive bias amid hawkish BoJ expectations; lacks bullish conviction amid tariff jitters
- The recent data from Japan showed solid economic growth and sticky inflation, which reaffirmed bets that the Bank of Japan will hike rates further and continue to lend support to the Japanese Yen.
- Japanese media reported that the BoJ could face pressure to hike interest rates from the US if the White House concludes that the JPY weakness is linked to the central bank's monetary policy.
- The au Jibun Bank Japan Manufacturing Purchasing Managers’ Index (PMI) was finalized at 49.0 for February, slightly higher than the 48.9 flash reading and marking the softest contraction in three months.
- US President Donald Trump confirmed his plans to impose tariffs on Canada and Mexico starting Tuesday and announced plans to double the 10% universal tariff on imports from China.
- The US Dollar struggles to capitalize on Friday's strong move up to over a one-week high touched in reaction to the crucial US inflation data and further exerts pressure on the USD/JPY pair.
- A report published by the US Bureau of Economic Analysis showed that the Personal Consumption Expenditures (PCE) Price Index edged lower to 2.5% in January from 2.6% previous.
- Adding to this, the core PCE Price Index, which excludes volatile food and energy prices, increased 2.6% on a yearly basis during the reported month, down from 2.9% in December.
- Investors have been pricing in the possibility that the Federal Reserve would resume cutting short-term borrowing costs in June and see another interest rate cut in September.
- Traders now look forward to the release of the US ISM Manufacturing PMI for some impetus later this Monday, though the focus remains on the US Nonfarm Payrolls on Friday.
USD/JPY needs to find acceptance above the 151.00 support-turned-resistance for bulls to seize near-term control
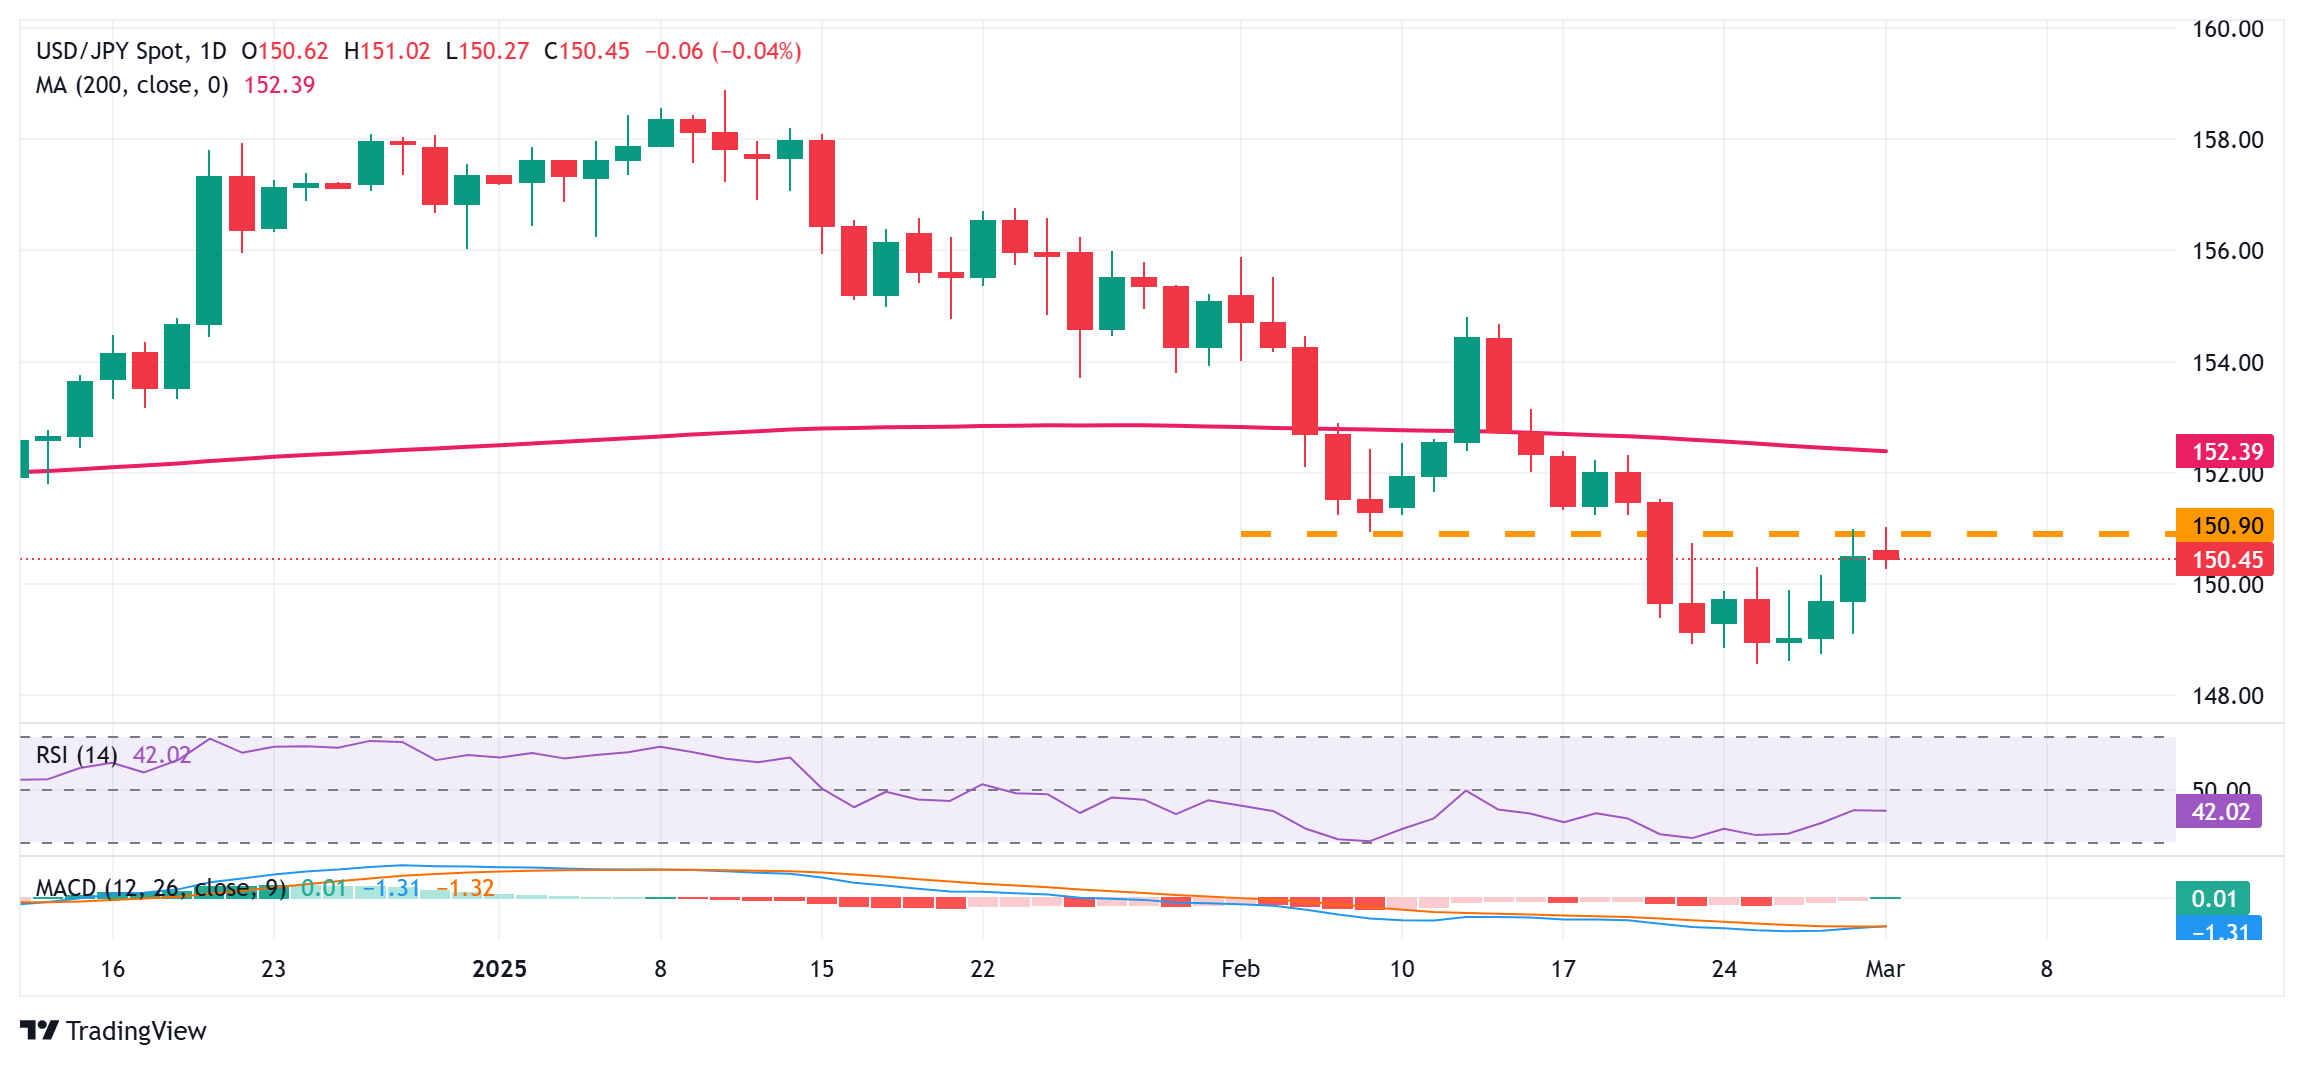
From a technical perspective, the USD/JPY pair stalls last week's recovery move from its lowest level since October 2024 near the 151.00 horizontal support breakpoint, now turned hurdle. Furthermore, oscillators on the daily chart – though they have been recovering from lower levels – are still holding in negative territory. This, in turn, suggests that the path of least resistance for spot prices remains to the downside. Hence, a subsequent fall, back toward the 150.00 psychological mark, looks like a distinct possibility. Some follow-through selling below the 149.80-149.75 region will be seen as a fresh trigger for bearish traders and drag the pair back toward the 149.00 mark en route to the 148.60-148.55 area, or the multi-month low.
However, a sustained strength beyond the 151.00 mark could trigger a short-covering rally and lift the USD/JPY pair beyond the 151.70-151.75 intermediate resistance, towards the 152.00 round figure. The momentum could extend further towards the very important 200-day Simple Moving Average (SMA), currently pegged near the 152.40 region. The latter should act as a key pivotal point, which if cleared decisively will suggest that spot prices have bottomed out and pave the way for a further near-term appreciating move.
Economic Indicator
ISM Manufacturing PMI
The Institute for Supply Management (ISM) Manufacturing Purchasing Managers Index (PMI), released on a monthly basis, is a leading indicator gauging business activity in the US manufacturing sector. The indicator is obtained from a survey of manufacturing supply executives based on information they have collected within their respective organizations. Survey responses reflect the change, if any, in the current month compared to the previous month. A reading above 50 indicates that the manufacturing economy is generally expanding, a bullish sign for the US Dollar (USD). A reading below 50 signals that factory activity is generally declining, which is seen as bearish for USD.
Read more.Next release: Mon Mar 03, 2025 15:00
Frequency: Monthly
Consensus: 50.8
Previous: 50.9
Source: Institute for Supply Management
The Institute for Supply Management’s (ISM) Manufacturing Purchasing Managers Index (PMI) provides a reliable outlook on the state of the US manufacturing sector. A reading above 50 suggests that the business activity expanded during the survey period and vice versa. PMIs are considered to be leading indicators and could signal a shift in the economic cycle. Stronger-than-expected prints usually have a positive impact on the USD. In addition to the headline PMI, the Employment Index and the Prices Paid Index numbers are watched closely as they shine a light on the labour market and inflation.
Forex News
Keep up with the financial markets, know what's happening and what is affecting the markets with our latest market updates. Analyze market movers, trends and build your trading strategies accordingly.