Japanese Yen appreciates following BoJ interest rate decision, inflation data
- The Japanese Yen maintains its position as the BoJ keeps its interest rate at 0.15% at Friday's meeting.
- Japan's Consumer Price Index rose to 3.0% YoY in August, reaching its highest level since October 2023.
- The US Dollar faces challenges due to rising odds for additional Fed rate cuts in 2024.
The Japanese Yen (JPY) holds ground against the US Dollar (USD) following the Bank of Japan (BoJ) policy decision on Friday, keeping its interest rate at 0.15%, as highly expected. Additionally, Japan's Consumer Price Index (CPI) increased to 3.0% year-on-year in August, up from 2.8% previously, marking the highest level since October 2023. Additionally, the Core National CPI, excluding fresh food, reached a six-month high of 2.8%, rising for the fourth consecutive month and in line with market expectations.
The downside of the USD/JPY pair is supported by a weaker US Dollar (USD) as expectations grow for additional rate cuts by the US Federal Reserve (Fed) by the end of 2024. The latest dot plot projections indicate a gradual easing cycle, with the 2024 median rate revised to 4.375%, down from the 5.125% forecast in June.
However, Federal Reserve Chair Jerome Powell stated in the post-meeting press conference that the Fed is not in a hurry to ease policy and emphasized that half-percentage point rate cuts are not the "new pace."
Daily Digest Market Movers: Japanese Yen receives support from the hawkish BoJ policy outlook
- Japan’s Finance Minister Shunichi Suzuki stated on Friday that he “will continue to monitor and analyze the impact of the latest US rate cut on the Japanese economy and financial markets.” Suzuki added that the Federal Reserve Bank’s (FRB) perspective on the US economy aligns with the Japanese government's view that the US economy is likely to expand.
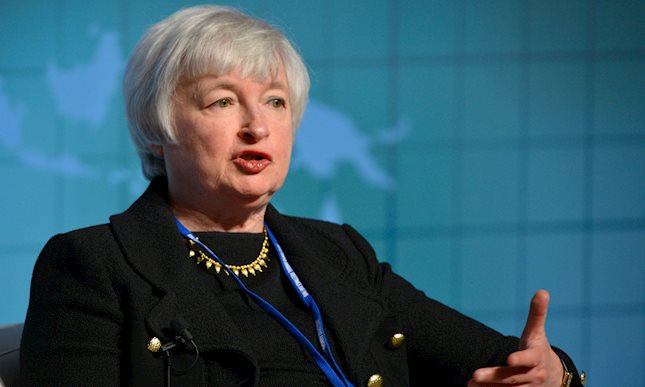
- US Treasury Secretary Janet Yellen stated on Friday that the recent interest rate cut by the Federal Reserve is a very positive indicator for the US economy. According to Yellen, it demonstrates the Fed's confidence that inflation has significantly decreased and is moving toward the 2% target. Meanwhile, the job market continues to show strength.
- The Federal Open Market Committee (FOMC) lowered the federal funds rate to a range of 4.75% to 5.0%, marking the Fed’s first rate cut in over four years. Fed policymakers updated their quarterly economic forecasts, increasing the median projection for unemployment to 4.4% by the end of 2024, up from the 4.0% estimate made in June. They also raised their long-term forecast for the federal funds rate from 2.8% to 2.9%.
- Federal Reserve Chair Jerome Powell commented on the aggressive 50 basis point rate cut, saying, “This decision reflects our increased confidence that, with the right adjustments to our policy approach, we can maintain a strong labor market, achieve moderate economic growth, and bring inflation down to a sustainable 2% level.”
- Japan’s Merchandise Trade Balance Total recorded a larger trade deficit of ¥695.30 billion in August, up from ¥628.70 billion the previous month, but well below market expectations of a ¥1,380.0 billion shortfall. Exports increased by 5.6% year-over-year, marking the ninth consecutive month of growth, but fell short of the anticipated 10.0%. Imports rose by just 2.3%, the slowest pace in five months, significantly underperforming the projected 13.4% rise.
- Japanese Finance Minister Shunichi Suzuki stated on Tuesday that rapid foreign exchange (FX) fluctuations are undesirable. Suzuki emphasized that officials will closely monitor how FX movements affect the Japanese economy and people's livelihoods. The government will continue to assess the impact of a stronger Japanese Yen and respond accordingly, according to Reuters.
- Commerzbank FX analyst Volkmar Baur anticipated that the Bank of Japan will remain on the sidelines this week. Baur noted that the Federal Reserve's actions are likely to have a greater impact on the USD/JPY pair, suggesting that the JPY could have a strong chance of falling below 140.00 per USD even without a rate hike from the BoJ.
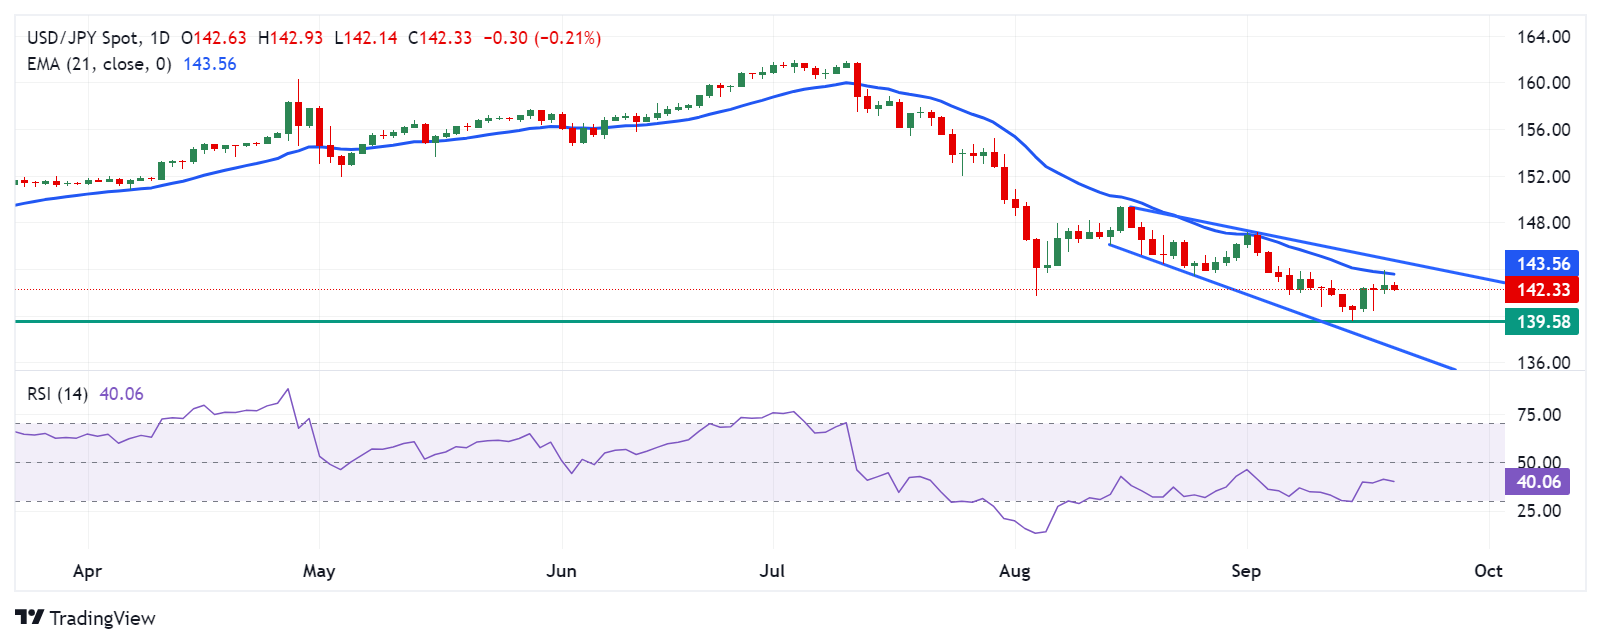
Technical Analysis: USD/JPY falls toward 142.00; further downside guided by 21-day EMA
USD/JPY trades around 142.30 on Friday. Analysis of the daily chart indicates that the pair is consolidating within a descending channel, which supports a bearish bias. However, the 14-day Relative Strength Index (RSI) remains below the 50 level, confirming an ongoing bearish outlook.
On the downside, the USD/JPY pair might find immediate support at 139.58, which is the lowest level since June 2023, followed by the lower boundary of the descending channel near 137.50.
On the resistance side, the 21-day Exponential Moving Average (EMA) at the 143.56 level acts as an initial barrier, followed by the upper boundary of the descending channel around the 144.80 level.
USD/JPY: Daily Chart
Japanese Yen PRICE Today
The table below shows the percentage change of Japanese Yen (JPY) against listed major currencies today. Japanese Yen was the strongest against the US Dollar.
| USD | EUR | GBP | JPY | CAD | AUD | NZD | CHF | |
|---|---|---|---|---|---|---|---|---|
| USD | -0.04% | -0.08% | -0.30% | -0.01% | -0.16% | -0.13% | -0.22% | |
| EUR | 0.04% | -0.04% | -0.24% | 0.03% | -0.13% | -0.08% | -0.18% | |
| GBP | 0.08% | 0.04% | -0.19% | 0.08% | -0.06% | -0.03% | -0.11% | |
| JPY | 0.30% | 0.24% | 0.19% | 0.30% | 0.14% | 0.16% | 0.10% | |
| CAD | 0.01% | -0.03% | -0.08% | -0.30% | -0.16% | -0.10% | -0.19% | |
| AUD | 0.16% | 0.13% | 0.06% | -0.14% | 0.16% | 0.05% | -0.03% | |
| NZD | 0.13% | 0.08% | 0.03% | -0.16% | 0.10% | -0.05% | -0.08% | |
| CHF | 0.22% | 0.18% | 0.11% | -0.10% | 0.19% | 0.03% | 0.08% |
The heat map shows percentage changes of major currencies against each other. The base currency is picked from the left column, while the quote currency is picked from the top row. For example, if you pick the Japanese Yen from the left column and move along the horizontal line to the US Dollar, the percentage change displayed in the box will represent JPY (base)/USD (quote).
Forex News
Keep up with the financial markets, know what's happening and what is affecting the markets with our latest market updates. Analyze market movers, trends and build your trading strategies accordingly.