US Dollar looking for direction after car tariffs being digested by markets
- The surprise effect from auto tariffs from US President Donald Trump is already starting to wear off.
- The GDP's third reading for the fourth quarter is not moving the needle.
- The US Dollar Index is near flat this Thursday and will probably remain flat going into Friday's PCE release
The US Dollar Index (DXY), which tracks the performance of the US Dollar (USD) against six major currencies, lacks a substantial catalyst and might be flatlining going into Friday's PCE data, trading around 104.35 at the time of writing. The DXY edged higher overnight on the back of tariff comments from United States (US) President Donald Trump. An additional 25% levy on all auto imports was issued to come into effect on April 3 and countries such as Canada and the European Union were threatened with more tariffs if they look to team up in their response to the US.
On the economic data front, all eyes shifted towards the US Gross Domestic Product (GDP) release.The third reading for the fourth quarter did not bring much news to the table. Nervousness will now build towards the US Personal Consumption Expenditures (PCE) data due on Friday.
Daily digest market movers: Done for today
- Nearly all important data for this Thursday have been released:
- US GDP third reading of the fourth quarter of 2024:
- Headline GDP Annualized came in a touch higher at 2.4% against the previous 2.3% reading.
- The headline Personal Consumption Expenditures (PCE) Prices remained stable at 2.4%.
- The core PCE component came in a touch softer at 2.6%, just below the 2.7%.
- US weekly jobless claims fell to 224,000, beating the 225,000 estimate and coming from the previous 223,000. Continuing claims came in better at 1.856 million, below the expected 1.900 million estimate and 1.892 million last week.
- US GDP third reading of the fourth quarter of 2024:
- At 15:00 GMT, the Kansas Fed Manufacturing Activity data for March is due. No forecast is available with the previous reading in contraction at -5.
- At 20:30 GMT, the President of the Federal Reserve Bank of Richmond Thomas Barkin speaks about the economy to the Home Building Association of Richmond.
- Equities are split again with European equities being stuck with a loss, while US equities are showing resilience and are heading into the green.
- According to the CME Fedwatch Tool, the probability of interest rates remaining at the current range of 4.25%-4.50% in May’s meeting is 89.7%. For June’s meeting, the odds for borrowing costs being lower stand at 63.6%.
- The US 10-year yield trades around 4.37%, ticking up as traders are heading from US Bonds into Gold again.
US Dollar Index Technical Analysis: Maybe PCE could get it moving again?
The US Dollar Index (DXY) is not really impressed by Trump’s recent tariff talks. The extensive moves seen in the precious metal space, such as Gold, must make US Dollar bulls jealous. Expect volatility in the DXY to start picking up once the US economic data starts to portray a much clearer picture regarding US exceptionalism, stagflation, or recession scenarios.
With the weekly close above 104.00 last week, a large sprint higher towards the 105.00 round level could still occur, with the 200-day Simple Moving Average (SMA) converging at that point and reinforcing this area as a strong resistance at 104.96. Once broken through that zone, a string of pivotal levels, such as 105.53 and 105.89, could limit the upward momentum.
On the downside, the 104.00 round level is the first nearby support after a successful bounce on Tuesday. If that does not hold, the DXY risks falling back into that March range between 104.00 and 103.00. Once the lower end at 103.00 gives way, watch out for 101.90 on the downside.
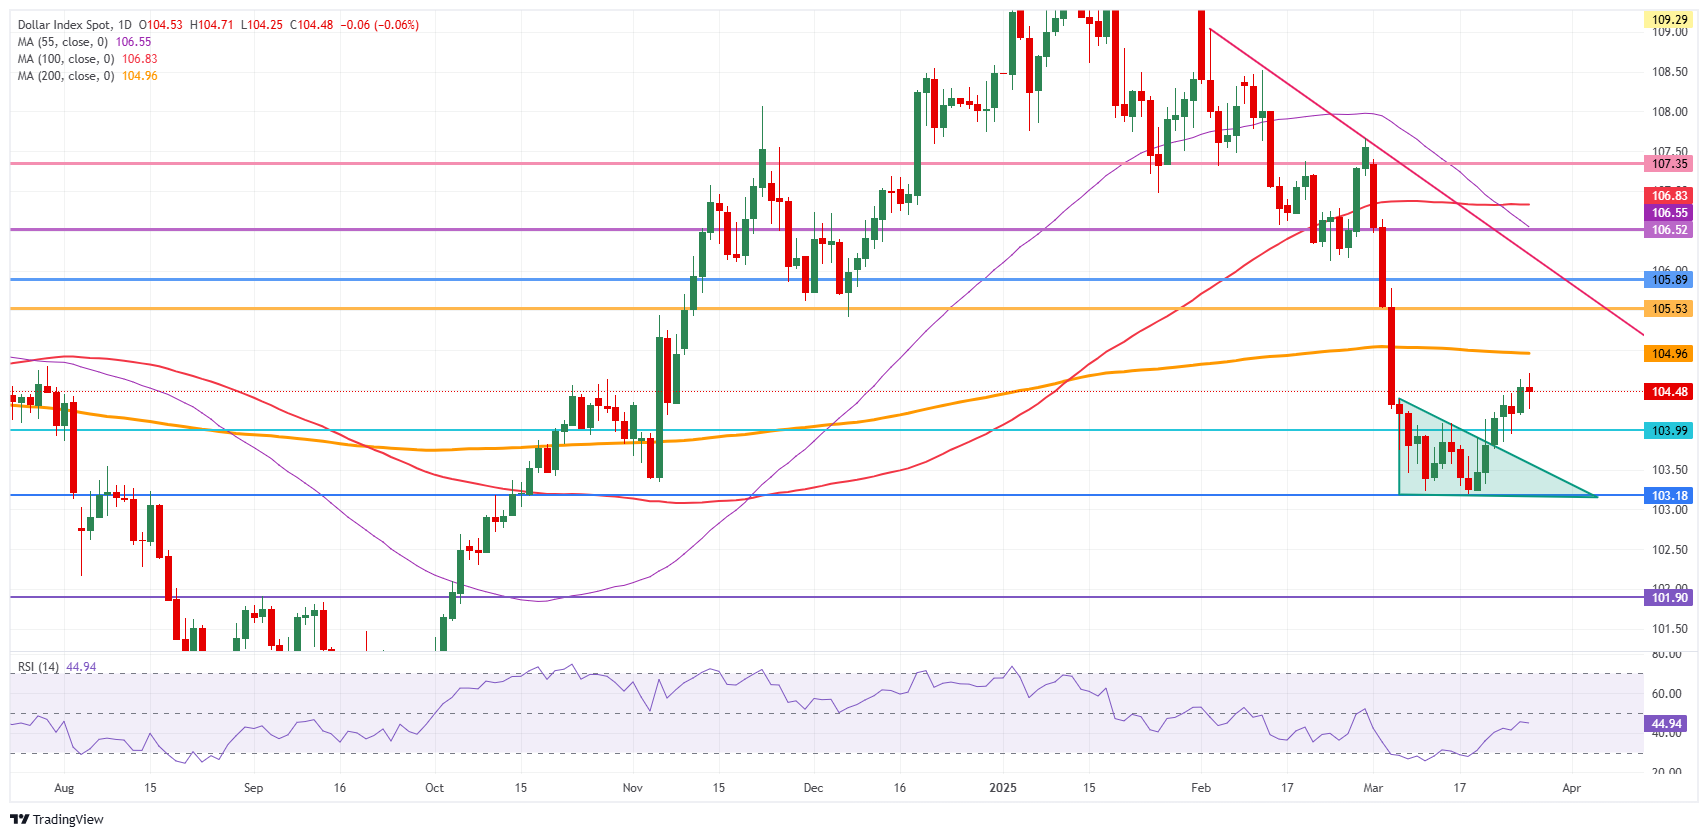
US Dollar Index: Daily Chart
Inflation FAQs
Inflation measures the rise in the price of a representative basket of goods and services. Headline inflation is usually expressed as a percentage change on a month-on-month (MoM) and year-on-year (YoY) basis. Core inflation excludes more volatile elements such as food and fuel which can fluctuate because of geopolitical and seasonal factors. Core inflation is the figure economists focus on and is the level targeted by central banks, which are mandated to keep inflation at a manageable level, usually around 2%.
The Consumer Price Index (CPI) measures the change in prices of a basket of goods and services over a period of time. It is usually expressed as a percentage change on a month-on-month (MoM) and year-on-year (YoY) basis. Core CPI is the figure targeted by central banks as it excludes volatile food and fuel inputs. When Core CPI rises above 2% it usually results in higher interest rates and vice versa when it falls below 2%. Since higher interest rates are positive for a currency, higher inflation usually results in a stronger currency. The opposite is true when inflation falls.
Although it may seem counter-intuitive, high inflation in a country pushes up the value of its currency and vice versa for lower inflation. This is because the central bank will normally raise interest rates to combat the higher inflation, which attract more global capital inflows from investors looking for a lucrative place to park their money.
Formerly, Gold was the asset investors turned to in times of high inflation because it preserved its value, and whilst investors will often still buy Gold for its safe-haven properties in times of extreme market turmoil, this is not the case most of the time. This is because when inflation is high, central banks will put up interest rates to combat it. Higher interest rates are negative for Gold because they increase the opportunity-cost of holding Gold vis-a-vis an interest-bearing asset or placing the money in a cash deposit account. On the flipside, lower inflation tends to be positive for Gold as it brings interest rates down, making the bright metal a more viable investment alternative.
Forex News
Keep up with the financial markets, know what's happening and what is affecting the markets with our latest market updates. Analyze market movers, trends and build your trading strategies accordingly.