Australian Dollar declines as US Dollar strengthens ahead of PCE inflation data release
- The Australian Dollar weakened as Trump reaffirmed his plan to impose an additional 10% tariff on Chinese imports.
- The US President Trump introduced new tariffs on Chinese goods on February 4, bringing the total levy to 20%.
- The US GDP Annualized grew by 2.3% in Q4 2024, matching market expectations.
The Australian Dollar (AUD) remains under pressure for the sixth consecutive day on Friday, with the AUD/USD pair extending its losing streak. The decline follows US President Donald Trump’s reaffirmation that his proposed 25% tariffs on Mexican and Canadian goods will take effect on March 4, along with an additional 10% duty on Chinese imports, citing ongoing concerns over drug trafficking into the US. Investors await the Personal Consumption Expenditures Price Index (PCE) data, the Federal Reserve’s preferred inflation gauge, due later in the day.
President Trump also imposed new tariffs on Chinese goods, adding to the 10% tariffs implemented on February 4 in response to the fentanyl opioid crisis, bringing the total levy to 20%. Any renewed US tariff threats could weigh on the China-linked AUD, given China’s status as Australia’s key trading partner.
The AUD also faced headwinds after Australia’s Private Capital Expenditure data, released on Thursday, unexpectedly contracted by 0.2% quarter-on-quarter in Q4 2024, missing market expectations of 0.8% growth. This follows an upwardly revised 1.6% expansion in the previous quarter.
Meanwhile, Reserve Bank of Australia Deputy Governor Andrew Hauser stated on Thursday that he expects further positive developments on inflation but stressed the need for tangible progress. He also highlighted that Australia’s tight labor market remains a key challenge in controlling inflation.
Australian Dollar depreciates due to risk-off mood
- The US Dollar Index (DXY), which measures the USD against six major currencies, gained ground following Thursday's release of Gross Domestic Product Annualized (Q4). The DXY rises above 107.00 at the time of writing.
- US GDP Annualized expanded by 2.3% in the fourth quarter of 2024. This figure matched the initial estimate and came in line with the market expectation.
- Federal Reserve Bank of Atlanta President Raphael Bostic said late Wednesday that the Fed should hold interest rates where they are, at a level that continues to put downward pressure on inflation, per Bloomberg.
- US Commerce Secretary Howard Lutnick said late Wednesday that April 3 serves as the baseline for reciprocal tariff data. Lutnick also stated that he would not allow Chinese vehicles in the US, citing China as his major concern.
- US Treasury Secretary Scott Bessent expressed his commitment to working with Congress to make President Trump's tax cuts permanent.
- The White House said late Wednesday that US President Donald Trump issued an executive order aimed at implementing the Department of Government Efficiency's (DOGE) cost-cutting drive, per Reuters. The executive order requires agencies to justify spending, limit travel, and identify surplus federal properties that can be sold.
- President Trump signed a memorandum on Friday instructing the Committee on Foreign Investment in the United States (CFIUS) to limit Chinese investments in strategic sectors. Reuters cited a White House official saying that the national security memorandum seeks to encourage foreign investment while safeguarding US national security interests from potential threats posed by foreign adversaries like China.
- The People’s Bank of China (PBOC) injected CNY300 billion on Tuesday via the one-year Medium-term Lending Facility (MLF), maintaining the rate at 2%. Additionally, the PBOC injected CNY318.5 billion through seven-day reverse repos at 1.50%, consistent with the prior rate.
- According to a Wall Street Journal report on the Australian Dollar’s outlook from the Commonwealth Bank of Australia (CBA), heightened trade war risks driven by Trump have become a major concern. China’s response to these trade threats will be a key factor shaping the future performance of the AUD.
- On Thursday, Lu Lei, Deputy Governor of the People's Bank of China (PBOC), proposed that the Bank should take an active role in supporting fundraising efforts, including issuing special treasury bonds, to help major state-owned banks strengthen their Common Equity Tier 1 (CET1) capital. Note that any change in the Chinese economy could impact the AUD as China and Australia are close trading partners.
- The Reserve Bank of Australia (RBA) lowered its Official Cash Rate (OCR) by 25 basis points to 4.10% last week—the first rate cut in four years. Reserve Bank of Australia (RBA) Governor Michele Bullock acknowledged the impact of high interest rates but cautioned that it is too soon to declare victory over inflation. She also emphasized the labor market's strength and clarified that future rate cuts are not guaranteed, despite market expectations.
Australian Dollar could test 0.6200 support as bearish bias strengthens
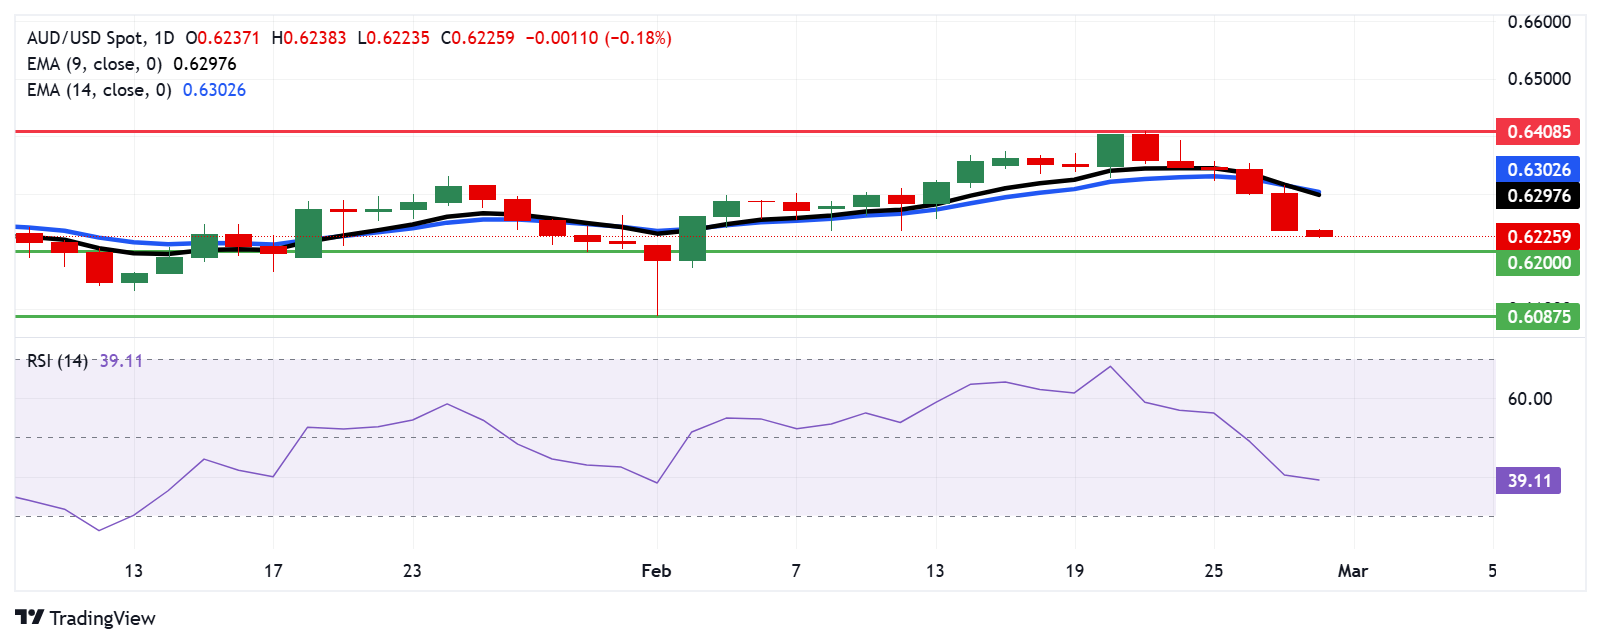
AUD/USD trades around 0.6220 on Friday. Analysis of the daily chart indicates that the pair stays below the nine- and 14-day Exponential Moving Averages (EMAs), signaling weakening short-term price momentum. Moreover, the 14-day Relative Strength Index (RSI) remains below 50, reinforcing the prevailing bearish outlook.
The AUD/USD pair tests immediate support at the psychological level of 0.6200. A break below this threshold could push the pair toward the 0.6087 region, its lowest level since April 2020, recorded on February 3.
On the upside, the AUD/USD pair may face immediate resistance at the nine-day EMA of 0.6297, followed by the 14-day EMA at 0.6302. A decisive break above these levels could strengthen short-term price momentum, paving the way for the pair to challenge the two-month high of 0.6408, reached on February 21.
AUD/USD: Daily Chart
Australian Dollar PRICE Today
The table below shows the percentage change of Australian Dollar (AUD) against listed major currencies today. Australian Dollar was the weakest against the US Dollar.
| USD | EUR | GBP | JPY | CAD | AUD | NZD | CHF | |
|---|---|---|---|---|---|---|---|---|
| USD | 0.18% | 0.27% | 0.21% | -0.01% | 0.40% | 0.62% | 0.05% | |
| EUR | -0.18% | 0.09% | 0.05% | -0.18% | 0.21% | 0.44% | -0.12% | |
| GBP | -0.27% | -0.09% | -0.06% | -0.28% | 0.13% | 0.35% | -0.23% | |
| JPY | -0.21% | -0.05% | 0.06% | -0.20% | 0.18% | 0.40% | -0.16% | |
| CAD | 0.00% | 0.18% | 0.28% | 0.20% | 0.39% | 0.63% | 0.04% | |
| AUD | -0.40% | -0.21% | -0.13% | -0.18% | -0.39% | 0.22% | -0.34% | |
| NZD | -0.62% | -0.44% | -0.35% | -0.40% | -0.63% | -0.22% | -0.57% | |
| CHF | -0.05% | 0.12% | 0.23% | 0.16% | -0.04% | 0.34% | 0.57% |
The heat map shows percentage changes of major currencies against each other. The base currency is picked from the left column, while the quote currency is picked from the top row. For example, if you pick the Australian Dollar from the left column and move along the horizontal line to the US Dollar, the percentage change displayed in the box will represent AUD (base)/USD (quote).
Economic Indicator
Personal Consumption Expenditures - Price Index (MoM)
The Personal Consumption Expenditures (PCE), released by the US Bureau of Economic Analysis on a monthly basis, measures the changes in the prices of goods and services purchased by consumers in the United States (US).. The MoM figure compares prices in the reference month to the previous month. Price changes may cause consumers to switch from buying one good to another and the PCE Deflator can account for such substitutions. This makes it the preferred measure of inflation for the Federal Reserve. Generally speaking, a high reading is bullish for the US Dollar (USD), while a low reading is bearish.
Read more.Next release: Fri Feb 28, 2025 13:30
Frequency: Monthly
Consensus: 0.3%
Previous: 0.3%
Source: US Bureau of Economic Analysis
Forex News
Keep up with the financial markets, know what's happening and what is affecting the markets with our latest market updates. Analyze market movers, trends and build your trading strategies accordingly.