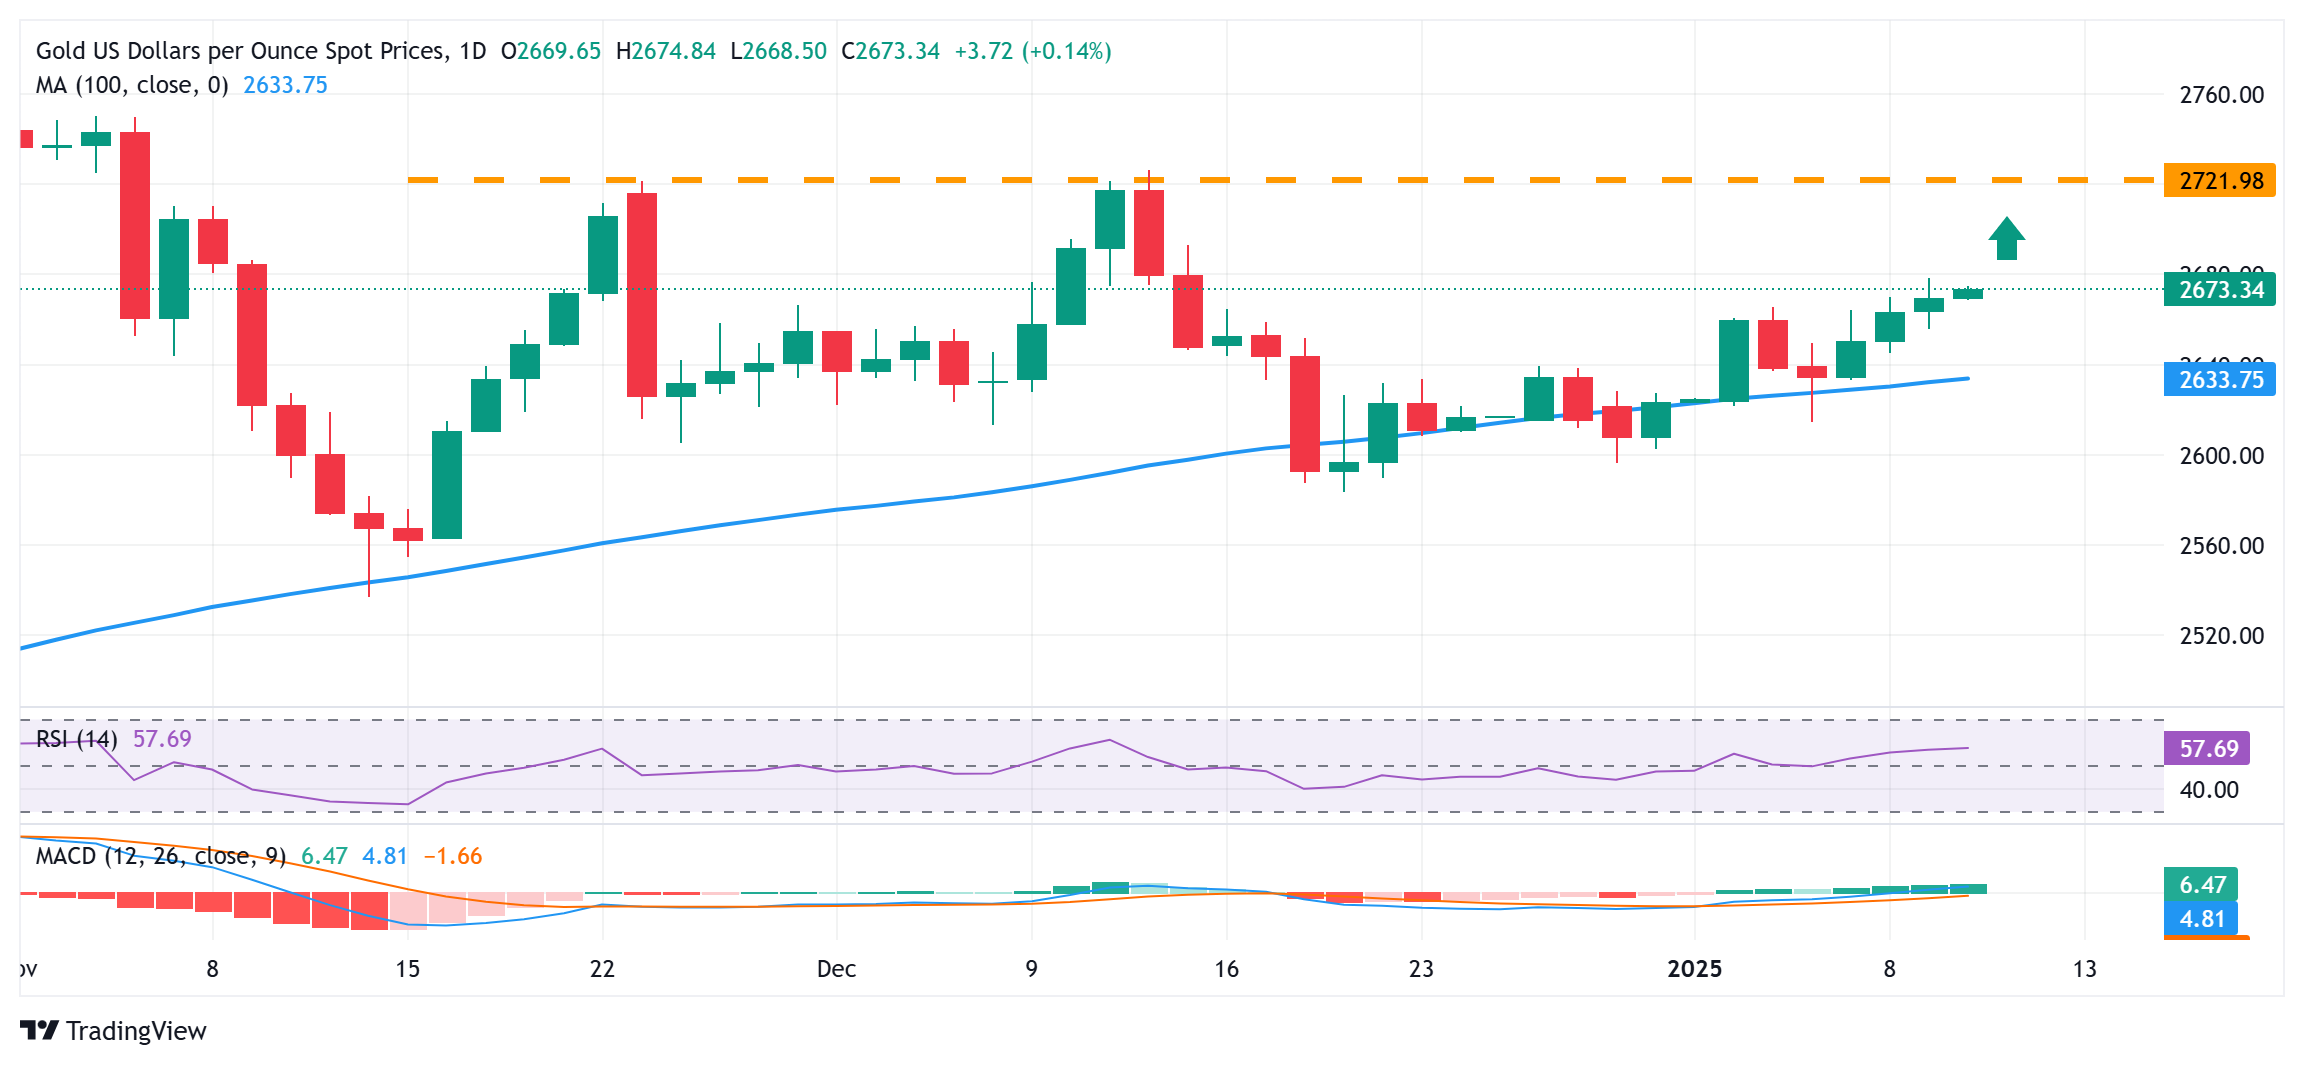
Gold price prolongs multi-day-old uptrend, refreshes multi-week top ahead of US NFP
- Gold price attracts buyers for the fourth straight day on Friday amid some haven flows.
- The Fed’s hawkish stance, elevated US bond yields and a bullish USD should cap gains.
- Traders might also opt to wait for the release of the key US NFP report later this Friday.
Gold price (XAU/USD) gains some follow-through positive traction for the fourth consecutive day and touches a fresh four-month peak, around the $2,680 region during the first half of the European session on Friday. Persistent geopolitical tensions stemming from the protracted Russia-Ukraine war and tensions in the Middle East, along with trade war fears and a weaker risk tone, continue to drive haven flows towards the precious metal.
Meanwhile, the momentum seems rather unaffected by the prospects for slower rate cuts by the Federal Reserve (Fed), which keeps the US Treasury bond yields elevated and tends to undermine the non-yielding Gold price. Even a bullish US Dollar (USD) does little to hinder the move-up, suggesting that the path of least resistance for the XAU/USD is to the upside. Traders now look to the US Nonfarm Payrolls (NFP) report for a fresh impetus.
Gold price bulls shrug off hawkish Fed, elevated US bond yields and a bullish USD
- CNN reported on Wednesday that US President-elect Donald Trump is considering declaring a national economic emergency to provide legal justification for universal tariffs on allies and adversaries.
- Ukrainian forces launched a new surprise offensive in Kursk, inside Russia on August 6 and were reported to have advanced in three waves using company-sized assaults backed by armoured vehicles.
- The Israel Defense Forces stated that the commander of Hamas' Sabra battalion in Gaza City, his deputy and two elite Nukhba company commanders were killed in a series of airstrikes last week.
- The Federal Reserve adopted a more hawkish stance in December and projected only two quarter-point interest rate cuts in 2025 amid still elevated inflation in the world's largest economy.
- Boston Fed President Susan Collins said on Thursday that the economy is on a gradual, uneven trajectory to the 2% inflation target and the current outlook calls for a patient approach to rate cuts.
- Philadelphia Fed President Patrick Harker noted that the central bank is expected to cut rates further but explained that the path will depend on data and that it is taking longer to get inflation back to 2%.
- Kansas Fed President Jeffrey Schmid noted that inflation is moving toward target, growth is showing momentum, and the jobs market is still healthy. Any further rate cuts should be gradual and data-driven.
- Fed Board of Governors member Michelle Bowman said that the current stance of policy may not be as restrictive as others may see it and pent-up demand following the election could pose inflationary risks.
- Trump's policies are expected to stoke further inflation and further force the Fed to slow the pace of rate cuts this year, which keeps the US Treasury bond yields close to a multi-month high touched last week.
- Traders now look forward to the release of the US Nonfarm Payrolls (NFP) report, which is expected to show that the economy added 160K jobs in December and the Unemployment Rate held steady at 4.2%.
Gold price bulls not ready to give up, move towards $2,700 looks like a distinct possibility

From a technical perspective, this week's breakout through the $2,665 horizontal resistance was seen as a fresh trigger for bullish traders. Given that oscillators on the daily chart have just started gaining positive traction, the Gold price seems poised to climb further to the $2,681-2,683 intermediate hurdle and then aim to reclaim the $2,700 round-figure mark.
On the flip side, dips towards the overnight swing low, around the $2,655 area, could be seen as a buying opportunity. This is followed by support near the $2,635 region and the weekly low, around the $2,615-2,614 zone touched on Monday, and the $2,600 confluence. The latter comprises the 100-day Exponential Moving Average (EMA) and a short-term ascending trend line extending from the November monthly low, which if broken decisively will shift the bias in favor of bearish traders.
US Dollar PRICE This week
The table below shows the percentage change of US Dollar (USD) against listed major currencies this week. US Dollar was the strongest against the British Pound.
| USD | EUR | GBP | JPY | CAD | AUD | NZD | CHF | |
|---|---|---|---|---|---|---|---|---|
| USD | 0.00% | 1.06% | 0.46% | -0.30% | 0.42% | 0.55% | 0.29% | |
| EUR | -0.01% | 1.05% | 0.44% | -0.25% | 0.45% | 0.58% | 0.32% | |
| GBP | -1.06% | -1.05% | -0.62% | -1.28% | -0.59% | -0.45% | -0.71% | |
| JPY | -0.46% | -0.44% | 0.62% | -0.78% | -0.04% | 0.11% | 0.04% | |
| CAD | 0.30% | 0.25% | 1.28% | 0.78% | 0.65% | 0.81% | 0.58% | |
| AUD | -0.42% | -0.45% | 0.59% | 0.04% | -0.65% | 0.14% | -0.12% | |
| NZD | -0.55% | -0.58% | 0.45% | -0.11% | -0.81% | -0.14% | -0.26% | |
| CHF | -0.29% | -0.32% | 0.71% | -0.04% | -0.58% | 0.12% | 0.26% |
The heat map shows percentage changes of major currencies against each other. The base currency is picked from the left column, while the quote currency is picked from the top row. For example, if you pick the US Dollar from the left column and move along the horizontal line to the Japanese Yen, the percentage change displayed in the box will represent USD (base)/JPY (quote).
Forex News
Keep up with the financial markets, know what's happening and what is affecting the markets with our latest market updates. Analyze market movers, trends and build your trading strategies accordingly.
