EUR/USD holds onto recovery despite traders price in ECB 50 bps rate cut
- EUR/USD trades above 1.0800, but the downside bias remains firm due to multiple headwinds.
- Traders expect the ECB to announce a sizeable interest rate cut in December.
- The Fed is expected to pursue a gradual rate-cut cycle.
EUR/USD clings to Thursday's recovery near 1.0830 in European trading hours on Friday. The recovery in the major currency pair is driven by a retracement move in the US Dollar (USD). The US Dollar Index (DXY), which gauges Greenback’s value against six major currencies, hovers near 104.00 after correcting from a fresh 12-week high of 104.55.
The near-term appeal of the US Dollar remains firm on multiple tailwinds, such as growing bets for the Federal Reserve (Fed) to follow a more gradual rate-cut cycle and rising expectations of former US President Donald Trump to win the presidential election against current Vice President Kamala Harris.
Investors' confidence in the Fed’s gradual policy-easing cycle is backed by upbeat Nonfarm Payrolls (NFP) and Retail Sales data for September and better-than-expected flash S&P Global PMI data for October, which pointed to sustainable economic growth.
On Friday, investors will focus on US Durable Goods Orders data for September, which will be published at 12:30 GMT. The economic data is estimated to have declined by 1% after remaining flat in August.
strives to extend Thursday’s recovery above 1.0800 in Friday’s European session. The major currency pair bounced back on Thursday after the release of the flash Hamburg Commercial Bank (HCOB) Eurozone Purchasing Managers Index (PMI) report for October.
Daily digest market movers: EUR/USD walks on thin rope
- The Euro’s recovery could be short-lived as the preliminary PMI report showed that the Eurozone’s economic activity continued to contract, with the flash Composite PMI declining to 49.7 in October. Preliminary readings showed that activities in the manufacturing sector continued to contract, with manufacturing PMI below the 50 threshold that separates expansion from contraction for 28 months, and the service sector output expanded surprisingly at a slower pace. A continuous decline in the Eurozone business activity points to uncertainty over economic growth.
- Meanwhile, growing speculation for a larger-than-usual interest rate cut by the European Central Bank (ECB) in its next policy meeting in December is also expected to push back the shared currency pair inside the woods. This year, the ECB has already reduced its Deposit Facility Rate three times by 25 basis points (bps) to 3.25%.
- Market expectations for the ECB to reduce its key borrowing rates by 50 bps in December have been boosted by dovish commentaries from a few policymakers who have highlighted risks of inflationary pressures remaining below the bank’s target of 2% due to fears of a downturn.
- This week, Governor of the Bank of Portugal and ECB policymaker Mario Centeno said that the option of a 50 bps rate cut in December is on the table. Centeno warned that downside risks to growth are accumulating.
- On the economic front, data released on Friday showed that the German IFO Business Climate, Current Assessment, and Expectations for October have come in better than expectations and prior releases. Historically, improving market sentiment points to a revival in economic conditions but the case appears to be unlikely due to weak business activity.
Euro PRICE Today
The table below shows the percentage change of Euro (EUR) against listed major currencies today. Euro was the strongest against the New Zealand Dollar.
| USD | EUR | GBP | JPY | CAD | AUD | NZD | CHF | |
|---|---|---|---|---|---|---|---|---|
| USD | 0.02% | -0.10% | 0.03% | -0.04% | 0.17% | 0.21% | 0.18% | |
| EUR | -0.02% | -0.11% | 0.02% | -0.06% | 0.14% | 0.19% | 0.16% | |
| GBP | 0.10% | 0.11% | 0.12% | 0.04% | 0.25% | 0.30% | 0.23% | |
| JPY | -0.03% | -0.02% | -0.12% | -0.08% | 0.13% | 0.18% | 0.13% | |
| CAD | 0.04% | 0.06% | -0.04% | 0.08% | 0.20% | 0.26% | 0.20% | |
| AUD | -0.17% | -0.14% | -0.25% | -0.13% | -0.20% | 0.05% | -0.02% | |
| NZD | -0.21% | -0.19% | -0.30% | -0.18% | -0.26% | -0.05% | -0.07% | |
| CHF | -0.18% | -0.16% | -0.23% | -0.13% | -0.20% | 0.02% | 0.07% |
The heat map shows percentage changes of major currencies against each other. The base currency is picked from the left column, while the quote currency is picked from the top row. For example, if you pick the Euro from the left column and move along the horizontal line to the US Dollar, the percentage change displayed in the box will represent EUR (base)/USD (quote).
Technical Analysis: EUR/USD strive for firm footing above 1.0800
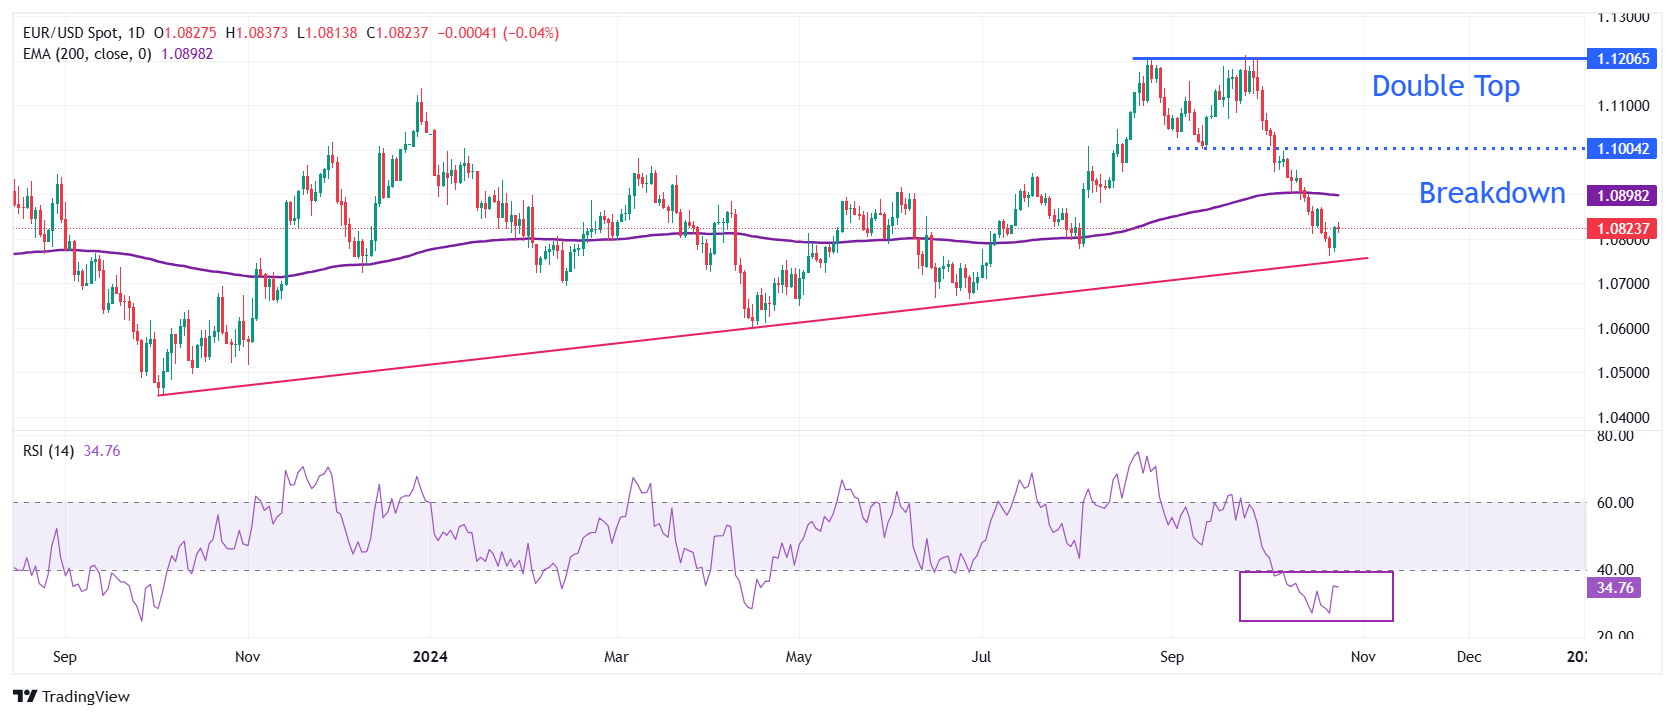
EUR/USD holds recovery above 1.0800 in European trading hours. However, the outlook of the major currency pair remains downbeat as it stays below the 200-day Exponential Moving Average (EMA), which trades around 1.0900.
The downside move in the shared currency pair started after a breakdown of a Double Top formation on the daily time frame near the September 11 low at around 1.1000, which resulted in a bearish reversal.
The 14-day Relative Strength Index (RSI) remains inside the 20.00-40.00 range, indicating a strong bearish momentum. However, a recovery move remains on the cards as conditions turn oversold.
On the downside, the major could see more weakness towards the round-level support of 1.0700 if it slips below the upward-sloping trendline (plotted from the October 3 low around 1.0450) at 1.0750. Meanwhile, the 200-day EMA near 1.0900, and the psychological figure of 1.1000 will be the key resistances for the pair.
Economic Indicator
HCOB Composite PMI
The Composite Purchasing Managers’ Index (PMI), released on a monthly basis by S&P Global and Hamburg Commercial Bank (HCOB), is a leading indicator gauging private-business activity in the Eurozone for both the manufacturing and services sectors. The data is derived from surveys to senior executives. Each response is weighted according to the size of the company and its contribution to total manufacturing or services output accounted for by the sub-sector to which that company belongs. Survey responses reflect the change, if any, in the current month compared to the previous month and can anticipate changing trends in official data series such as Gross Domestic Product (GDP), industrial production, employment and inflation. The index varies between 0 and 100, with levels of 50.0 signaling no change over the previous month. A reading above 50 indicates that the private economy is generally expanding, a bullish sign for the Euro (EUR). Meanwhile, a reading below 50 signals that activity is generally declining, which is seen as bearish for EUR.
Read more.Last release: Thu Oct 24, 2024 08:00 (Prel)
Frequency: Monthly
Actual: 49.7
Consensus: 49.7
Previous: 49.6
Source: S&P Global
Forex News
Keep up with the financial markets, know what's happening and what is affecting the markets with our latest market updates. Analyze market movers, trends and build your trading strategies accordingly.