Dow Jones Industrial Average post modest gains ahead of US PCE figures
- Wall Street indexes finished Tuesday mixed, not far from their daily opening levels.
- Energy and Utilities are leading gains with the Tech sector lagging on portfolio adjustment moves.
- Investors’ focus is on Friday’s PCE Prices Index data and Fed Powell’s speech.
Trading was choppy on Thursday, albeit Wall Street managed to maintain its optimistic tone. The Dow Jones Industrial Average (DJIA) ended the day up 0.12%, adding 47 points. At the same time, the benchmark S&P 500 gained 9 points and settled at 5,257.92, while the NASDAQ Composite Index shed 0.12% or 20 points.
United States (US) indexes finished the quarter with solid gains and near record highs amid mounting confidence the country will dodge a recession. Data released on Thursday pointed in such direction, as the Q4 Gross Domestic Product (GDP) was upwardly revised to 3.4% on an annualized basis, up from the previous estimate of 3.2%.
Dow Jones news
The Energy and Utilities sectors led gains in the Dow Jones on Thursday with advances of 1.03% and 0.6%, respectively, while the Communication Services and Consumer Discretionary sectors, giving away 0.25% each, lagging behind.
Leading the stocks is Walt Disney (DIS), with 1.26% gains trading at $122.5, followed closely by 3M (MMM), up 1.24% at $105.88. The big tech companies are giving away previous gains on the back of end-of-quarter portfolio adjustments, which leaves Apple (AAPL) as the biggest loser, down 0.88% to $171.81, followed by Home Depot (HD) with a 0.6% decline to $383.58.
Earlier on Thursday, the US Q4 Gross Domestic Product was upwardly revised to a 0.6% growth from the 0.4% previously estimated. Beyond that, weekly Jobless Claims declined to 210,000 from 212,000 in the week of March 22, against market expectations of an incremental move to 215,000.
The focus now is on Friday’s PCE Prices Index, which is expected to provide further clues on the Federal Reserve’s monetary policy, and the Fed Chair speech due shortly afterward.
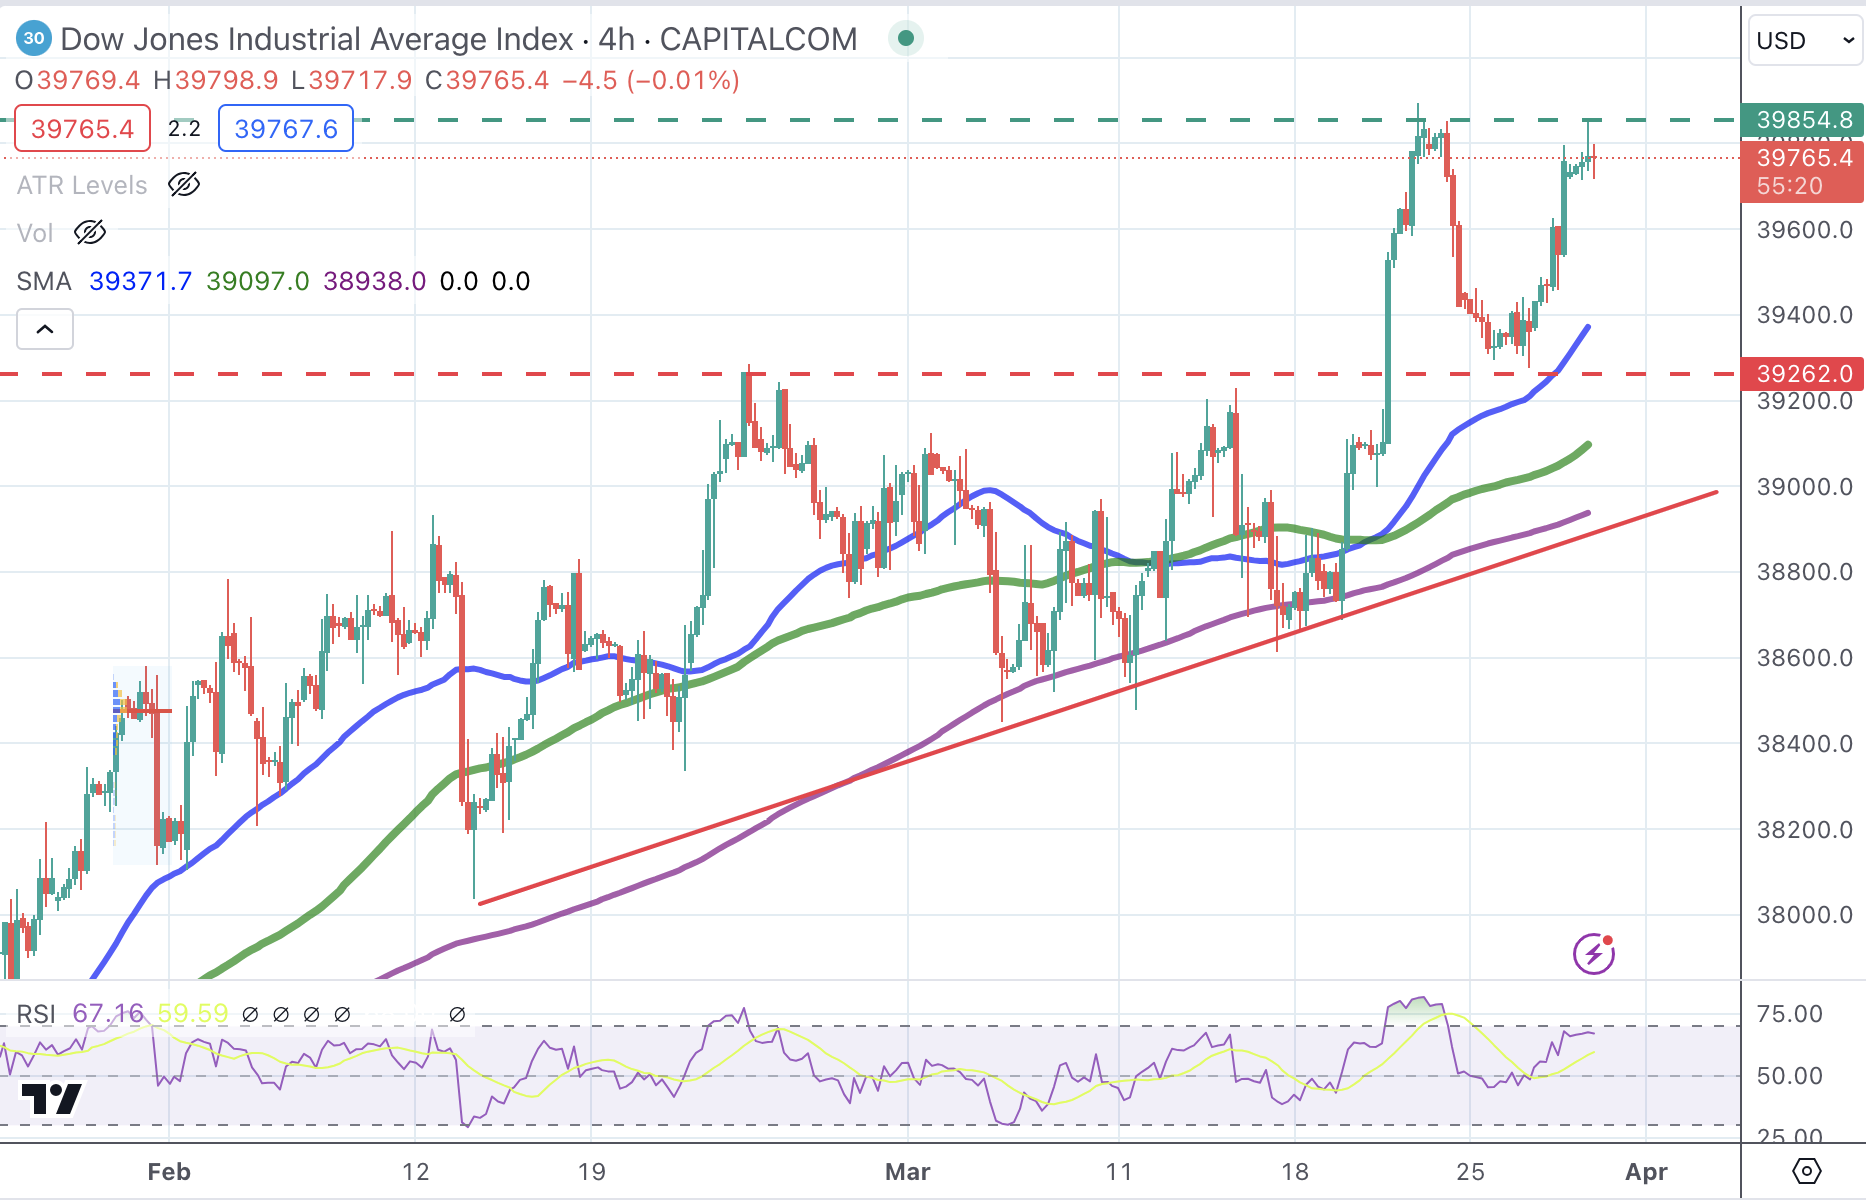
Dow Jones technical outlook
The Dow Jones Index remains bullish, standing comfortably above previous highs, and the 4-hour 50 Simple Moving Average (SMA), at 39,250. Below here, the next downside targets lie at the 39,260 level and the trendline support at 38,775.
On the upside, resistances at the 39,900 previous high and the 40,000 psychological level are likely to offer significant pushback for bulls.
Dow Jones Industrial Average 4-Hour Chart
S&P 500 FAQs
The S&P 500 is a widely followed stock price index which measures the performance of 500 publicly owned companies, and is seen as a broad measure of the US stock market. Each company’s influence on the computation of the index is weighted based on market capitalization. This is calculated by multiplying the number of publicly traded shares of the company by the share price. The S&P 500 index has achieved impressive returns – $1.00 invested in 1970 would have yielded a return of almost $192.00 in 2022. The average annual return since its inception in 1957 has been 11.9%.
Companies are selected by committee, unlike some other indexes where they are included based on set rules. Still, they must meet certain eligibility criteria, the most important of which is market capitalization, which must be greater than or equal to $12.7 billion. Other criteria include liquidity, domicile, public float, sector, financial viability, length of time publicly traded, and representation of the industries in the economy of the United States. The nine largest companies in the index account for 27.8% of the market capitalization of the index.
There are a number of ways to trade the S&P 500. Most retail brokers and spread betting platforms allow traders to use Contracts for Difference (CFD) to place bets on the direction of the price. In addition, that can buy into Index, Mutual and Exchange Traded Funds (ETF) that track the price of the S&P 500. The most liquid of the ETFs is State Street Corporation’s SPY. The Chicago Mercantile Exchange (CME) offers futures contracts in the index and the Chicago Board of Options (CMOE) offers options as well as ETFs, inverse ETFs and leveraged ETFs.
Many different factors drive the S&P 500 but mainly it is the aggregate performance of the component companies revealed in their quarterly and annual company earnings reports. US and global macroeconomic data also contributes as it impacts on investor sentiment, which if positive drives gains. The level of interest rates, set by the Federal Reserve (Fed), also influences the S&P 500 as it affects the cost of credit, on which many corporations are heavily reliant. Therefore, inflation can be a major driver as well as other metrics which impact the Fed decisions.
Forex News
Keep up with the financial markets, know what's happening and what is affecting the markets with our latest market updates. Analyze market movers, trends and build your trading strategies accordingly.