
Japanese Yen adds to strong gains as risk-off mood continues to boost safe-haven demand
- The Japanese Yen rallies across the board amid Trump’s tariff-inspired global flight to safety.
- The narrowing of the US-Japan rate differential drives flows toward the lower-yielding JPY.
- The divergent BoJ-Fed expectations support prospects for a further USD/JPY depreciation.
The Japanese Yen (JPY) sticks to its strong intraday gains through the early European session on Thursday, which, along with a broad-based US Dollar (USD) selling, keeps the USD/JPY pair heavily offered tone below the 147.00 mark or a nearly four-week low. Investors grew increasingly concerned that US President Donald Trump's sweeping reciprocal tariffs could reshape the global trading system and impact negatively on the world economy. This, in turn, takes its toll on the global risk sentiment and boosts demand for traditional safe-haven assets, including the JPY.
Meanwhile, investors now seem convinced that the Bank of Japan (BoJ) will raise rates further amid a broadening inflation in Japan. This marks a big divergence in comparison to expectations that the Federal Reserve (Fed) will resume its rate-cutting cycle soon amid a tariff-driven US economic slowdown. Furthermore, the anti-risk flow triggers a steep decline in the US Treasury bond yields, resulting in the narrowing of the rate differential between Japan and the US. This turns out to be another factor that contributes to driving flows toward the lower-yielding JPY.
Japanese Yen bulls retain control amid the global rush to safety on the back of Trump's sweeping tariffs
- The global risk sentiment took a turn for the worst after US President Donald Trump unveiled reciprocal tariffs of at least 10% on all imported goods, sparking concerns over slowing global economic growth.
- Stock markets around the world plunged in reaction to the US tariffs announcement, lifting the safe-haven Japanese Yen to a three-week high against the US Dollar during the Asian session on Thursday.
- Japan's Prime Minister Shigeru Ishiba said that he will not hesitate to directly approach US president Trump if appropriate and will continue to demand US to reconsider tariff measures.
- The anti-risk flow saw most global government bond yields fall, with the yield on the benchmark 10-year US government bond tumbling to the 4.0% neighborhood and hitting a fresh year-to-date low.
- Traders lifted bets that the Federal Reserve will start lowering borrowing costs at the June policy meeting and deliver a total of three 25-basis-point reductions to the policy rate by the end of this year.
- This, to a larger extent, overshadows Wednesday's upbeat US ADP report, which showed that private-sector employers added 155K jobs in March, far more than the 105K expected and 84K previous.
- Meanwhile, worries about the impact of harsher-than-expected US tariffs on Japan's economy forced investors to scale back their bets that the Bank of Japan would raise policy rate at a faster pace.
- However, the incoming macro data, including strong consumer inflation figures from Tokyo released last Friday, keeps the door open for further BoJ rate hikes, which, in turn, underpins the JPY.
- Traders now look forward to Thursday's US economic docket – featuring Weekly Initial Jobless Claims and the ISM Services PMI. The focus, however, will remain on trade-related developments.
USD/JPY bears might now aim to challenge multi-month low; break below the 147.00 mark in play
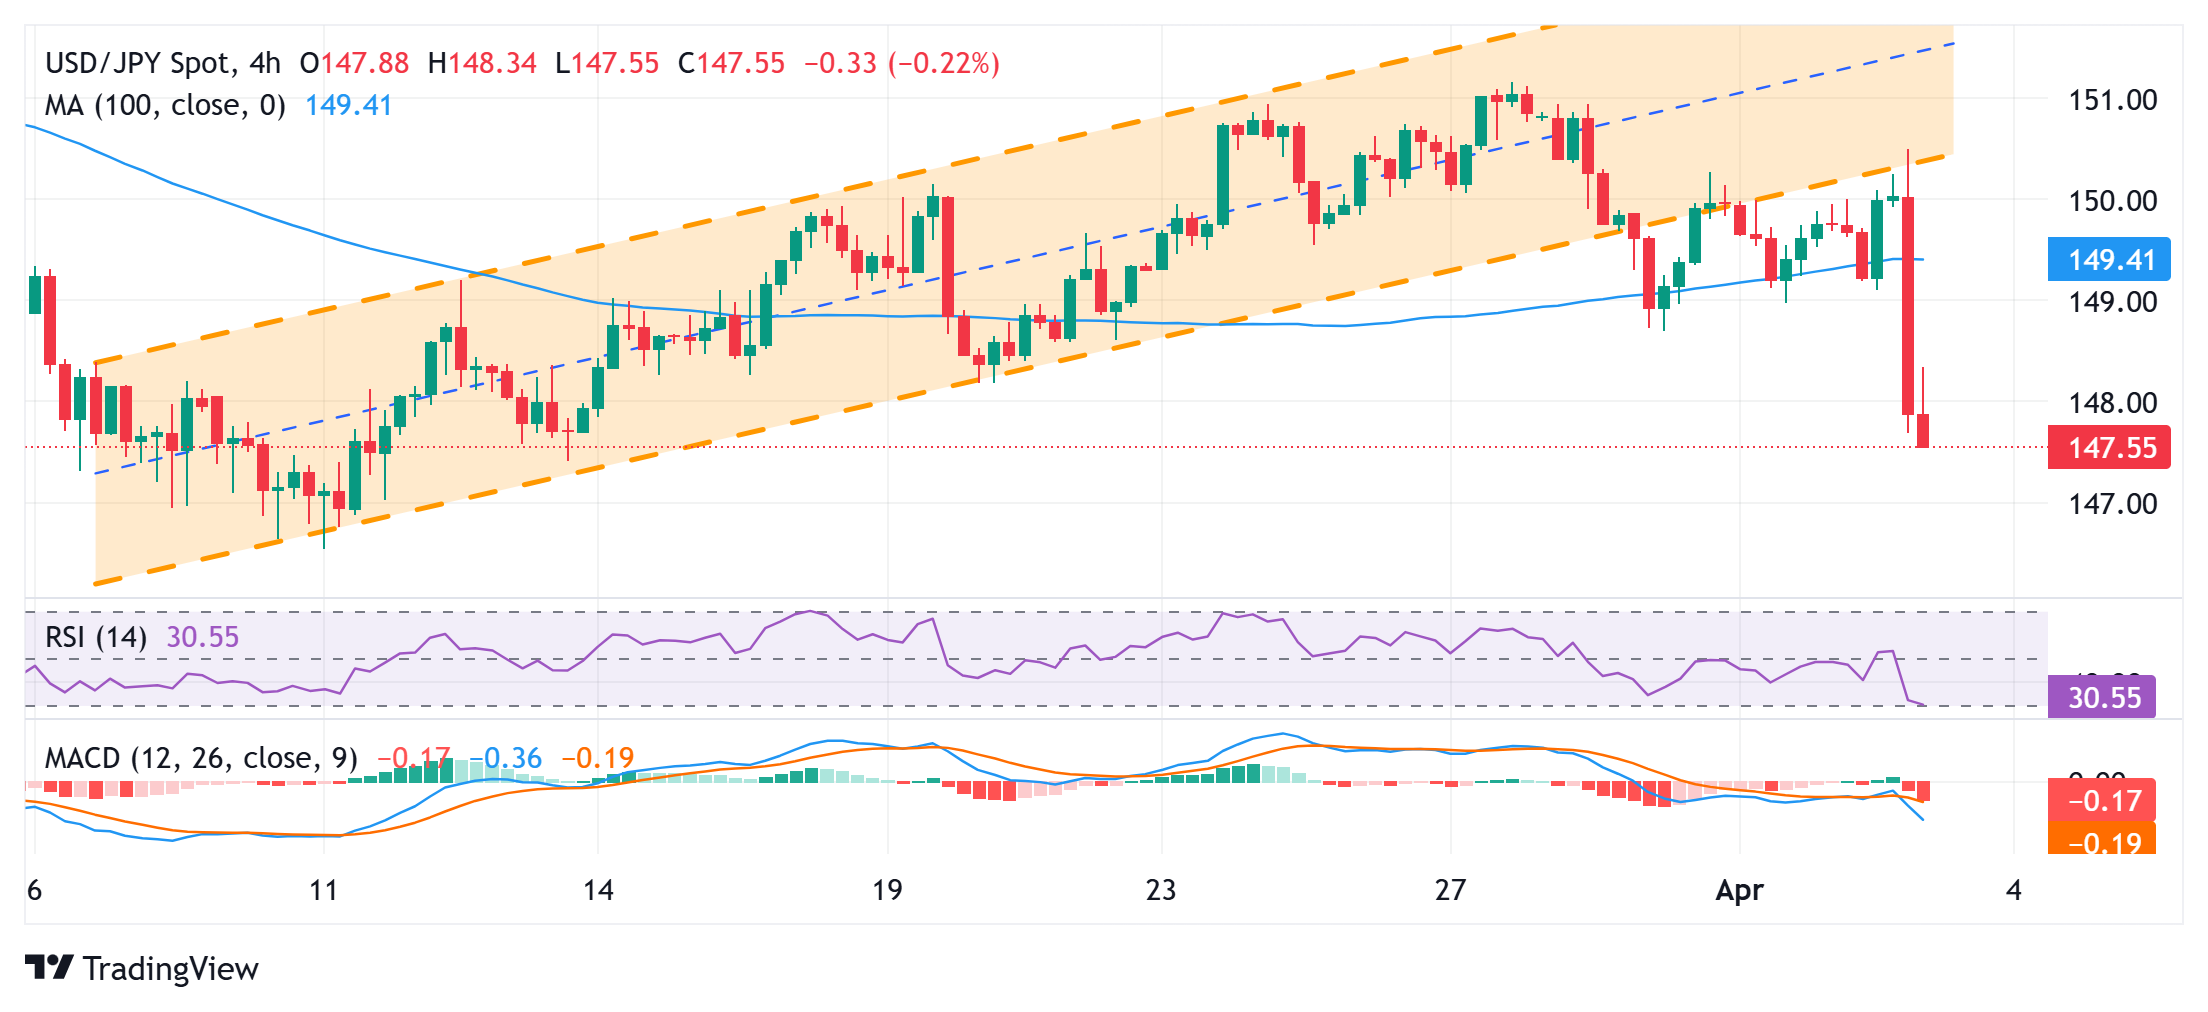
From a technical perspective, the intraday slump below the 100-period Simple Moving Average (SMA) on the 4-hour chart comes on top of the recent breakdown through a multi-week-old ascending channel. This, along with bearish oscillators on the daily chart, supports prospects for a further near-term depreciation for the USD/JPY pair. Furthermore, a subsequent slide below the 147.00 mark now seems to have set the stage for a fall towards the 146.55-146.50 region or a multi-month low touched in March.
On the flip side, any attempted recovery might now confront hurdle near the 148.00 mark. A sustained move, however, could trigger a short-covering rally towards the 148.65-148.70 region. That said, a further move up, is likely to attract fresh sellers near the 149.00 mark and cap the USD/JPY pair near the 149.35-149.40 region, or the 100-period SMA on the 4-hour chart. The latter should act as a key pivotal point, which if cleared might negate the negative outlook and pave the way for further gains.
US Dollar PRICE Today
The table below shows the percentage change of US Dollar (USD) against listed major currencies today. US Dollar was the strongest against the Australian Dollar.
| USD | EUR | GBP | JPY | CAD | AUD | NZD | CHF | |
|---|---|---|---|---|---|---|---|---|
| USD | -1.17% | -0.58% | -1.60% | -0.46% | -0.17% | -0.49% | -1.42% | |
| EUR | 1.17% | 0.33% | -0.40% | 0.74% | 1.05% | 0.70% | -0.24% | |
| GBP | 0.58% | -0.33% | -0.71% | 0.40% | 0.72% | 0.37% | -0.60% | |
| JPY | 1.60% | 0.40% | 0.71% | 1.12% | 1.47% | 0.98% | 0.16% | |
| CAD | 0.46% | -0.74% | -0.40% | -1.12% | 0.39% | -0.04% | -1.00% | |
| AUD | 0.17% | -1.05% | -0.72% | -1.47% | -0.39% | -0.34% | -1.28% | |
| NZD | 0.49% | -0.70% | -0.37% | -0.98% | 0.04% | 0.34% | -0.96% | |
| CHF | 1.42% | 0.24% | 0.60% | -0.16% | 1.00% | 1.28% | 0.96% |
The heat map shows percentage changes of major currencies against each other. The base currency is picked from the left column, while the quote currency is picked from the top row. For example, if you pick the US Dollar from the left column and move along the horizontal line to the Japanese Yen, the percentage change displayed in the box will represent USD (base)/JPY (quote).
Forex News
Keep up with the financial markets, know what's happening and what is affecting the markets with our latest market updates. Analyze market movers, trends and build your trading strategies accordingly.