
Australian Dollar depreciates as US Dollar holds position ahead of PCE Price data
- The Australian Dollar depreciates as global trade concerns intensify ahead of potential US tariffs.
- A Reuters poll suggests the Reserve Bank of Australia (RBA) will keep rates steady in April.
- The US Gross Domestic Product Annualized grew by 2.4% in Q4 2024, exceeding the 2.3% forecast.
The Australian Dollar (AUD) weakens against the US Dollar (USD) on Friday, erasing gains from the previous session. The AUD/USD pair declines amid heightened risk aversion, driven by concerns over impending US auto tariffs.
US President Donald Trump signed an order on Wednesday imposing a 25% tariff on auto imports, further escalating global trade tensions. These aggressive trade measures are likely to strain relations with key trading partners, even ahead of his planned reciprocal tariffs set for April 2.
A Reuters poll on the Reserve Bank of Australia (RBA) indicates that the central bank will hold rates steady in April. All 39 economists surveyed expect the RBA to maintain the cash rate at 4.10% on April 1. However, the median forecast predicts two rate cuts in 2025, with 25 basis point reductions in May and September, bringing the rate down to 3.60% by Q3.
Goldman Sachs has revised its forecast for the Reserve Bank of Australia's rate cut, shifting the expected 25 basis point reduction from April to May. Previously, the firm had projected the cut to take place on April 1.
The RBA is expected to ease rates gradually due to persistently high core inflation at 3.2%, low unemployment, and recovering economic growth. The potential May rate cut hinges on Q1 inflation data, with approximately 75% of economists anticipating a reduction.
Westpac economists believe the RBA will keep the cash rate unchanged at its April 1 policy meeting, describing it as a “dead rubber” in the broader monetary policy context. However, they maintain their forecast for a rate cut in May.
Australian Prime Minister Anthony Albanese announced on Friday that a national election will be held on May 3, kicking off a five-week campaign expected to focus on cost-of-living concerns. Albanese's Labor Party secured a majority in the 2022 federal election, but recent polls indicate a tight race with the opposition Liberal-National coalition once votes from smaller parties are factored in.
Australian Dollar struggles as US Dollar steadies amid increased risk aversion
- The US Dollar Index (DXY), which tracks the USD against six major currencies, hovers around 104.30, facing pressure due to lower US yields, standing at 3.99% for the 2-year bond and 4.35% for the 10-year bond at the time of writing.
- US Gross Domestic Product (GDP) Annualized expanded at a rate of 2.4% in Q4 2024, surpassing the 2.3% forecast, according to data released on Thursday. Investors now await the US Personal Consumption Expenditures (PCE) Price Index, set for release later on Friday.
- Moody’s has warned that increased tariffs and tax cuts could significantly widen government deficits, potentially leading to a US debt rating downgrade and rising Treasury yields.
- S&P Global cautioned that policy uncertainty in the US could dampen global economic growth, while Fitch Ratings highlighted that current tariffs may severely impact smaller economies such as Brazil, India, and Vietnam, making it more challenging for them to afford US goods.
- Federal Reserve (Fed) Bank of Boston President Susan Collins stated on Thursday that the Fed faces a difficult decision between maintaining a restrictive policy stance or acting pre-emptively in anticipation of deteriorating economic conditions.
- Meanwhile, Federal Reserve Bank of Richmond President Thomas Barkin warned that economic uncertainty stemming from the Trump administration’s trade policies could force the Fed into a more cautious, wait-and-see approach than markets are expecting.
- China has introduced an ambitious plan to improve the quality and sustainability of its aluminum industry by 2027. Led by ten government departments, including the Ministry of Industry and Information Technology, the initiative aims to set high standards for the sector’s growth.
- Chinese President Xi Jinping met with top executives from companies such as BMW, Mercedes, and Qualcomm. As the US scales back its global engagement, China is positioning itself to strengthen international business ties.
- On Wednesday, Trump suggested plans to impose tariffs on copper imports within weeks, although the Commerce Department initially had until November 2025 to decide on the matter. This development, however, provided some support for the AUD, as Australia is a key copper exporter.
- Australian Treasurer Jim Chalmers presented the 2025/26 budget on Tuesday, outlining key economic forecasts and tax cuts totaling approximately A$17.1 billion across two rounds. The budget deficit is projected at A$27.6 billion for 2024-25 and A$42.1 billion for 2025-26. GDP growth is expected to reach 2.25% in the fiscal year 2026 and 2.5% in 2027. The tax cuts appear to be aimed at strengthening political support.
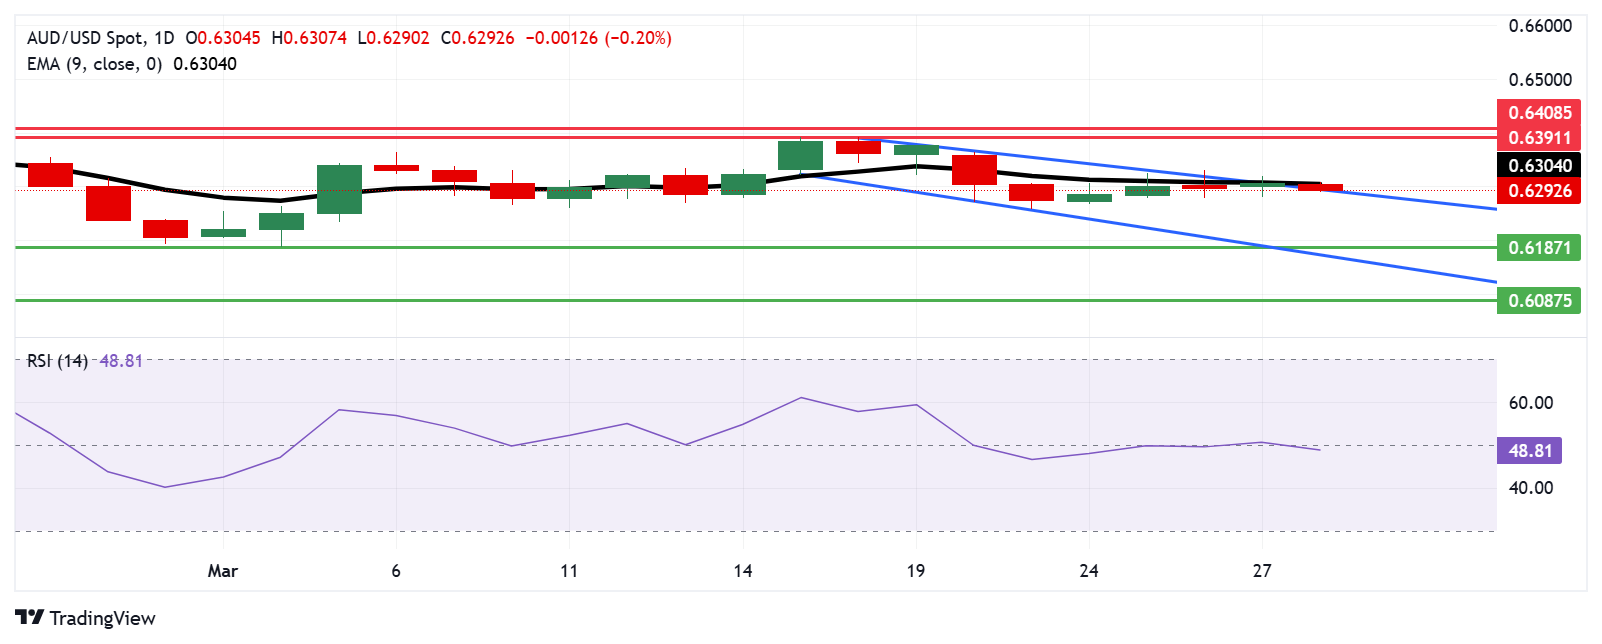
Australian Dollar holds near 0.6300, confluence of nine-day EMA, upper channel boundary
AUD/USD hovers near 0.6290 on Friday, with technical indicators suggesting a potential bullish shift as the pair challenges its descending channel pattern. However, the 14-day Relative Strength Index (RSI) remains just below 50, signaling persistent bearish pressure.
The nine-day Exponential Moving Average (EMA) at 0.6304 acts as immediate resistance. A breakout above this level could strengthen short-term momentum, opening the door for a test of the monthly high at 0.6391, last reached on March 18, followed by a three-month high at 0.6408.
On the downside, failure to hold gains may push the AUD/USD pair back into its descending channel, reinforcing the bearish outlook. In this scenario, the pair could drop toward the seven-week low of 0.6187, recorded on March 5, followed by the channel’s lower boundary at 0.6170.
AUD/USD: Daily Chart
Australian Dollar PRICE Today
The table below shows the percentage change of Australian Dollar (AUD) against listed major currencies today. Australian Dollar was the weakest against the Japanese Yen.
| USD | EUR | GBP | JPY | CAD | AUD | NZD | CHF | |
|---|---|---|---|---|---|---|---|---|
| USD | 0.10% | 0.07% | -0.09% | 0.06% | 0.31% | 0.43% | 0.09% | |
| EUR | -0.10% | -0.05% | -0.23% | -0.07% | 0.19% | 0.31% | -0.04% | |
| GBP | -0.07% | 0.05% | -0.18% | -0.02% | 0.24% | 0.36% | 0.02% | |
| JPY | 0.09% | 0.23% | 0.18% | 0.14% | 0.41% | 0.53% | 0.19% | |
| CAD | -0.06% | 0.07% | 0.02% | -0.14% | 0.25% | 0.37% | 0.04% | |
| AUD | -0.31% | -0.19% | -0.24% | -0.41% | -0.25% | 0.12% | -0.22% | |
| NZD | -0.43% | -0.31% | -0.36% | -0.53% | -0.37% | -0.12% | -0.34% | |
| CHF | -0.09% | 0.04% | -0.02% | -0.19% | -0.04% | 0.22% | 0.34% |
The heat map shows percentage changes of major currencies against each other. The base currency is picked from the left column, while the quote currency is picked from the top row. For example, if you pick the Australian Dollar from the left column and move along the horizontal line to the US Dollar, the percentage change displayed in the box will represent AUD (base)/USD (quote).
Economic Indicator
Core Personal Consumption Expenditures - Price Index (YoY)
The Core Personal Consumption Expenditures (PCE), released by the US Bureau of Economic Analysis on a monthly basis, measures the changes in the prices of goods and services purchased by consumers in the United States (US). The PCE Price Index is also the Federal Reserve’s (Fed) preferred gauge of inflation. The YoY reading compares the prices of goods in the reference month to the same month a year earlier. The core reading excludes the so-called more volatile food and energy components to give a more accurate measurement of price pressures." Generally, a high reading is bullish for the US Dollar (USD), while a low reading is bearish.
Read more.Next release: Fri Mar 28, 2025 12:30
Frequency: Monthly
Consensus: 2.7%
Previous: 2.6%
Source: US Bureau of Economic Analysis
After publishing the GDP report, the US Bureau of Economic Analysis releases the Personal Consumption Expenditures (PCE) Price Index data alongside the monthly changes in Personal Spending and Personal Income. FOMC policymakers use the annual Core PCE Price Index, which excludes volatile food and energy prices, as their primary gauge of inflation. A stronger-than-expected reading could help the USD outperform its rivals as it would hint at a possible hawkish shift in the Fed’s forward guidance and vice versa.
Forex News
Keep up with the financial markets, know what's happening and what is affecting the markets with our latest market updates. Analyze market movers, trends and build your trading strategies accordingly.