
Gold price sticks to gains near all-time high ahead of US PPI; bulls shrug off modest USD strength
- Gold price gains positive traction for the third straight day and climbs to a two-week high.
- Trade war fears and Fed rate cut bets underpin the XAU/USD pair ahead of the US PPI.
- A modest USD uptick holds back bulls from placing fresh bets and caps the precious metal.
Gold price (XAU/USD) retains its positive bias through the first half of the European session on Thursday and remains within striking distance of the record high touched on February 24. Persistent worries about the potential economic fallout from US President Donald Trump's aggressive trade policies benefit the safe-haven bullion for the third successive day. Apart from this, the growing acceptance that the Federal Reserve (Fed) will cut interest rates several times this year amid worries about a tariff-driven US economic slowdown further underpins the non-yielding yellow metal.
Meanwhile, the US Dollar (USD) gains some positive traction and looks to build on the overnight bounce from its lowest level since October 16. This, in turn, might hold back traders from placing fresh bullish bets around the Gold price and cap any further appreciating move. Nevertheless, the aforementioned fundamental backdrop suggests that the path of least resistance for the XAU/USD pair remains to the upside. Investors now look forward to the release of the US Producer Price Index (PPI) to grab short-term opportunities later during the early North American session.
Daily Digest Market Movers: Gold price sticks to gains as rising trade tensions offset modest USD uptick
- The uncertainty surrounding US President Donald Trump's aggressive trade tariffs fuels concerns about the potential economic slowdown and continues to push investors toward traditional safe-haven assets.
- Trump's 25% tariff on all steel and aluminum imports took effect on Wednesday. Moreover, Trump threatened that he would respond to any countermeasures announced by the European Union and Canada.
- The European Commission on Wednesday said that the EU will impose tariffs on $28 billion worth of US goods from next month, while Canada announced 25% tariffs on more than $20 billion worth of US goods.
- Adding to this, a cooler US inflation report released on Wednesday lifted market bets for three 25-basis-point rate cuts each by the Federal Reserve at the June, July, and October monetary policy meetings.
- A report published by the US Bureau of Labor Statistics (BLS) showed that the headline Consumer Price Index (CPI) eased more than expected, to the 2.8% YoY rate in February from 3% in the previous month.
- Adding to this, the core gauge, which excludes volatile food and energy prices, rose 3.1% on a yearly basis during the reported month, marking a slowdown from the 3.3% increase registered in January.
- The US Dollar Index, which measures the Greenback against a basket of currencies, move away from its lowest level since October 16, though it does little to hinder a three-day-old uptrend for the Gold price.
- Traders now look forward to the US economic docket, featuring the release of the Producer Price Index (PPI), for a fresh impetus and to grab short-term opportunities later during the North American session.
Gold price approaches all-time peak around the $2,956 area; bulls not ready to give up yet
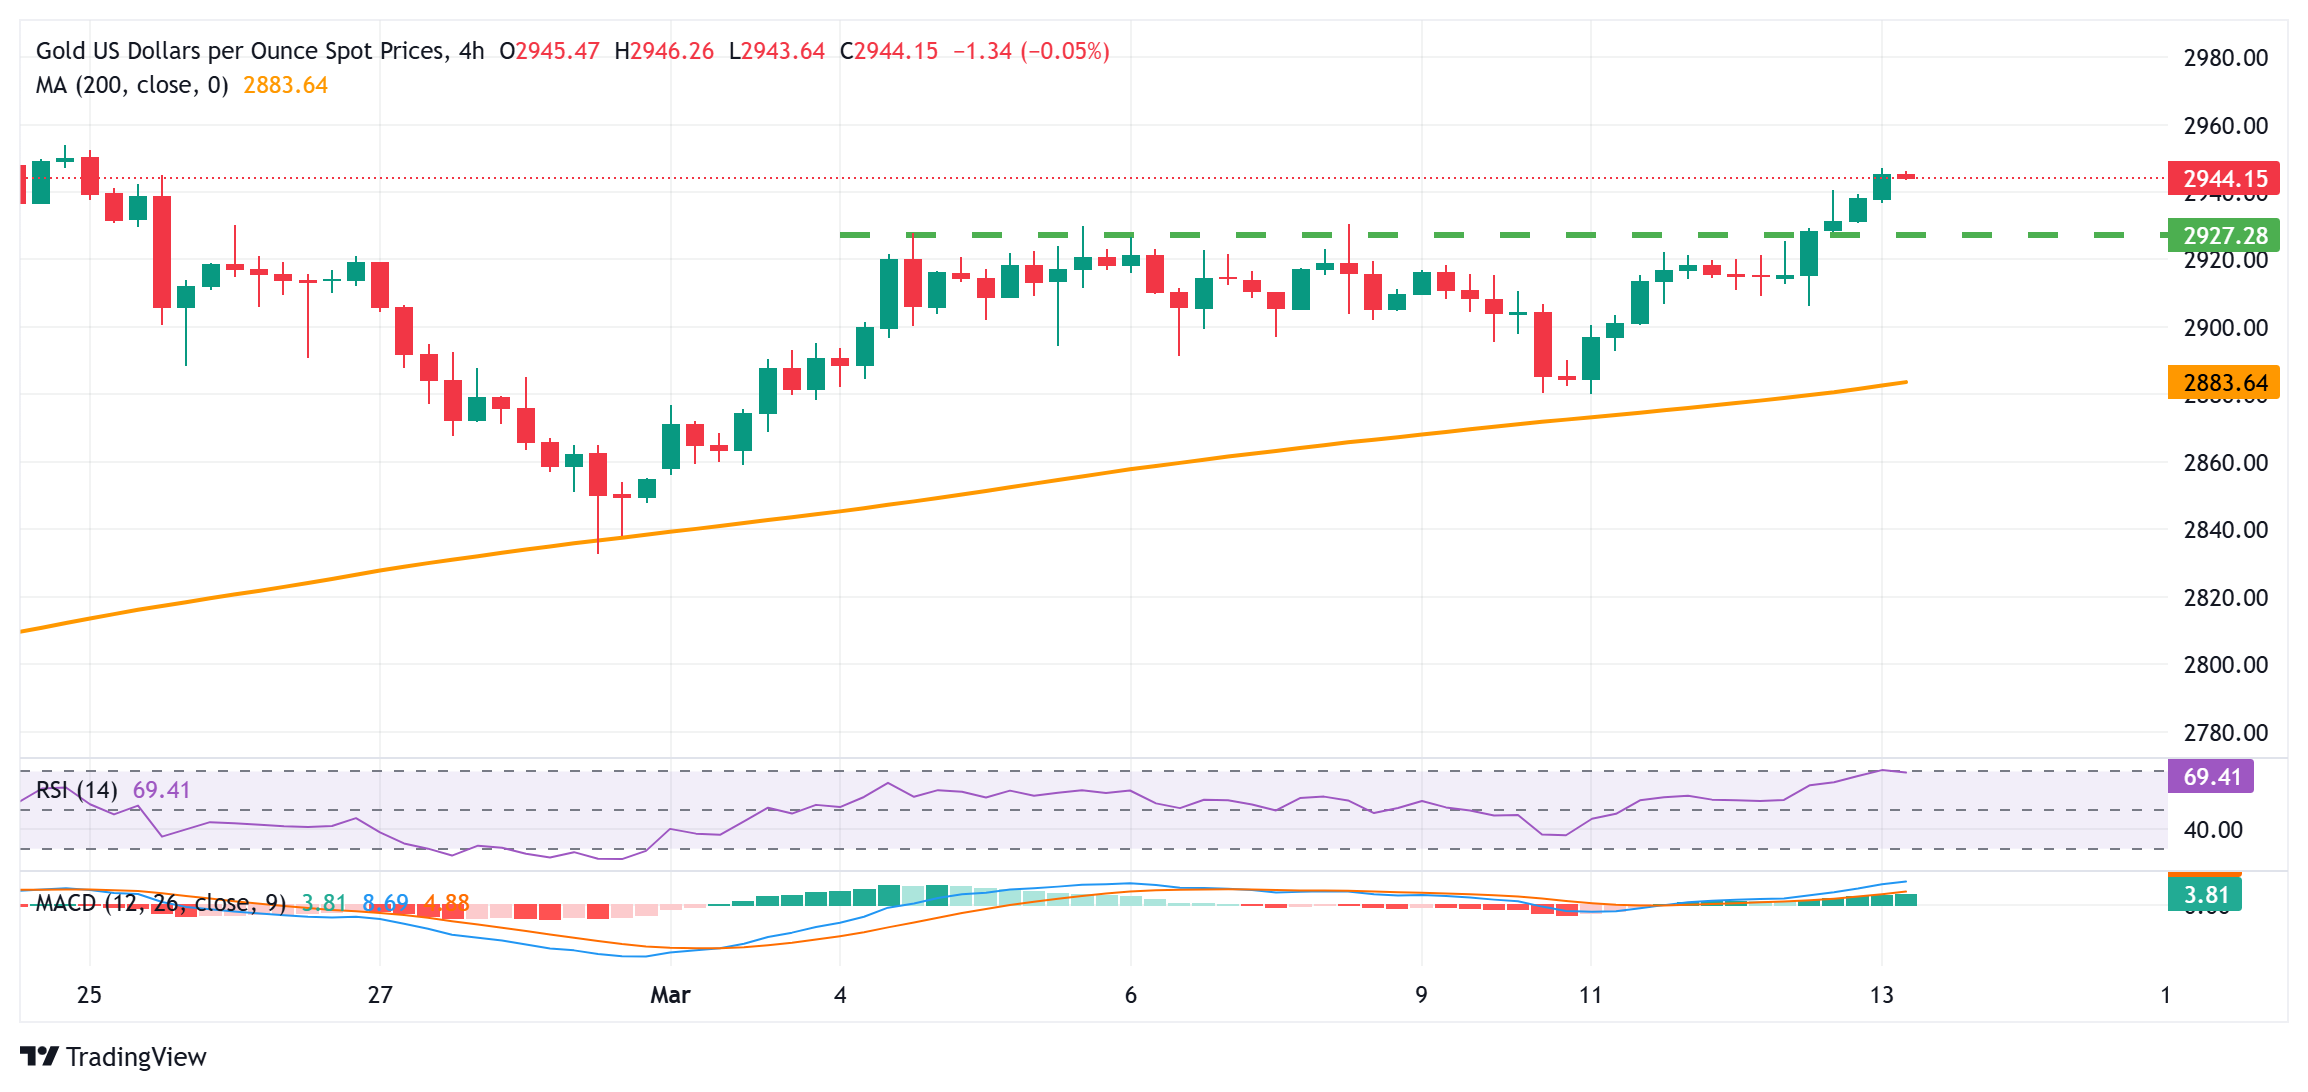
From a technical perspective, the overnight sustained move beyond the $2,928-2,930 horizontal barrier supports prospects for a move towards challenging the all-time peak, around the $2,956 area touched on February 24. Given that oscillators on the daily chart are holding comfortably in positive territory and are still away from being in the overbought zone, some follow-through buying will be seen as a fresh trigger for bulls. This, in turn, will set the stage for an extension of the recent well-established uptrend witnessed over the past three months or so.
On the flip side, the $2,930-2,828 resistance breakpoint now seems to protect the immediate downside, below which the Gold price could accelerate the slide back towards the $2,912-2,910 intermediate support en route to the $2,900 round figure. This is followed by the weekly low, around the $2,800 region. This is followed by the $2,860 zone, which if broken decisively could pave the way for deeper losses. The XAU/USD pair might then slide towards the late February swing low, around the $2,833-2,832 region, before eventually dropping to the $2,800 mark.
US Dollar PRICE Today
The table below shows the percentage change of US Dollar (USD) against listed major currencies today. US Dollar was the strongest against the Australian Dollar.
| USD | EUR | GBP | JPY | CAD | AUD | NZD | CHF | |
|---|---|---|---|---|---|---|---|---|
| USD | 0.08% | -0.00% | -0.31% | 0.09% | 0.35% | 0.29% | -0.10% | |
| EUR | -0.08% | -0.09% | -0.37% | 0.00% | 0.27% | 0.23% | -0.17% | |
| GBP | 0.00% | 0.09% | -0.33% | 0.09% | 0.37% | 0.32% | -0.08% | |
| JPY | 0.31% | 0.37% | 0.33% | 0.39% | 0.67% | 0.61% | 0.23% | |
| CAD | -0.09% | -0.00% | -0.09% | -0.39% | 0.28% | 0.22% | -0.18% | |
| AUD | -0.35% | -0.27% | -0.37% | -0.67% | -0.28% | -0.05% | -0.43% | |
| NZD | -0.29% | -0.23% | -0.32% | -0.61% | -0.22% | 0.05% | -0.36% | |
| CHF | 0.10% | 0.17% | 0.08% | -0.23% | 0.18% | 0.43% | 0.36% |
The heat map shows percentage changes of major currencies against each other. The base currency is picked from the left column, while the quote currency is picked from the top row. For example, if you pick the US Dollar from the left column and move along the horizontal line to the Japanese Yen, the percentage change displayed in the box will represent USD (base)/JPY (quote).
Forex News
Keep up with the financial markets, know what's happening and what is affecting the markets with our latest market updates. Analyze market movers, trends and build your trading strategies accordingly.