GBP/USD swings amid US tariff speculation, Trump comments
- GBP/USD fluctuates between 1.2450 and 1.2550 after conflicting reports on US tariff plans by President-elect Trump.
- UK services sector momentum slows as December S&P Global Services PMI drops from 51.4 to 51.1.
- Federal Reserve Governor Lisa Cook hints at cautious rate cuts amidst persistent inflation and strong labor market.
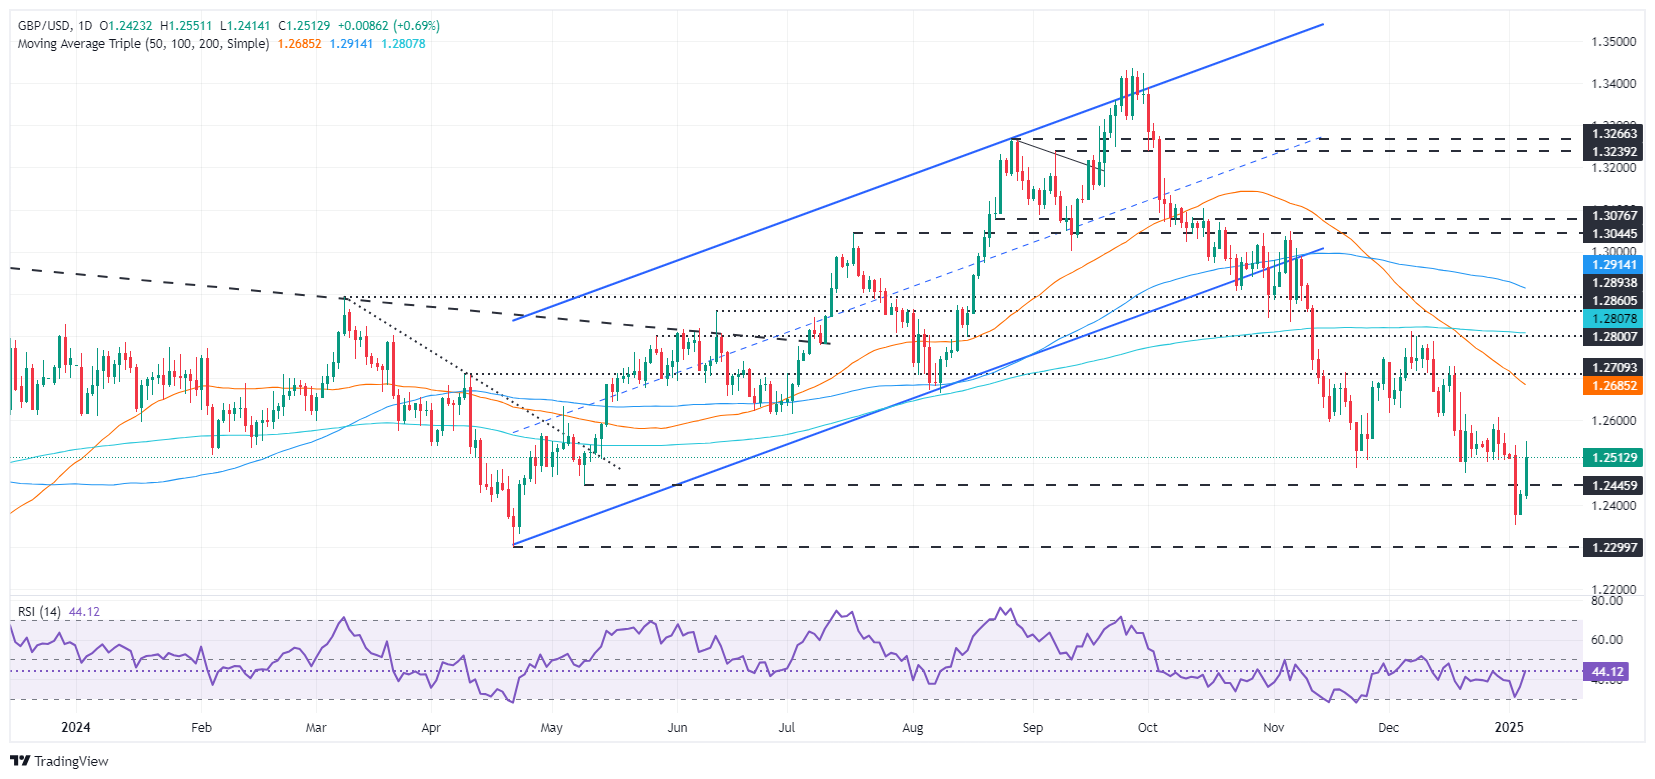
The Pound Sterling begins the week on the front foot against the US Dollar after news emerged that US President-elect Trump's aides are considering tariffs on “certain sectors,” according to the Washington Post. Nevertheless, recent news headlines suggested that Trump backpedaled, saying the Washington Post story was wrong. The GBP/USD is trading volatile within the 1.2450 – 1.2550 range as market players diggest recent news.
GBP/USD sees volatile trading as markets react to mixed signals from the US and UK economic indicators
According to three people familiar with the matter, a Washington Post story revealed that tariffs are considered but only cover critical imports.
Data-wise, the UK economic docket revealed that British business in the services sector had lost momentum, as shown by the December S&P Global Services PMI, which dipped from 51.4 to 51.1.
The British Chambers of Commerce also revealed on Sunday that confidence fell to its lowest level since former PM Liz Truss's “mini-budget” in 2022. According to Reuters, “Businesses were the least happy about taxation since they started asking about this in 2017, while confidence about sales over the next 12 months was the lowest since late 2022.”
In the meantime, Federal Reserve (Fed) Governor Lisa Cook said they can proceed more cautiously in cutting rates due to stickier inflation and labor market resilience.
Recently, S&P Global revealed that the Services PMI for the US dupped to 56.8 from 58.5, higher than forecasts of 56.1
GBP/USD Price Forecast: Technical outlook
The GBP/USD daily chart suggests further downside is seen unless buyers achieve a daily close above November’s 22 swing low of 1.2486. In that outcome, the pair could consolidate and it might open the door for bulls to challenge the next key resistance at 1.2607, December’s 30 peak.
Conversely, if GBP/USD remains below 1.2500, the pair could consolidate within the 1.2480 – 1.2500 range before sellers push prices towards 1.2400.

British Pound PRICE Today
The table below shows the percentage change of British Pound (GBP) against listed major currencies today. British Pound was the strongest against the Japanese Yen.
| USD | EUR | GBP | JPY | CAD | AUD | NZD | CHF | |
|---|---|---|---|---|---|---|---|---|
| USD | -0.83% | -0.72% | 0.08% | -0.86% | -0.78% | -0.71% | -0.59% | |
| EUR | 0.83% | 0.11% | 0.87% | 0.02% | 0.08% | 0.15% | 0.27% | |
| GBP | 0.72% | -0.11% | 0.79% | -0.09% | -0.02% | 0.05% | 0.16% | |
| JPY | -0.08% | -0.87% | -0.79% | -0.91% | -0.80% | -0.72% | -0.41% | |
| CAD | 0.86% | -0.02% | 0.09% | 0.91% | 0.01% | 0.11% | 0.24% | |
| AUD | 0.78% | -0.08% | 0.02% | 0.80% | -0.01% | 0.07% | 0.19% | |
| NZD | 0.71% | -0.15% | -0.05% | 0.72% | -0.11% | -0.07% | 0.11% | |
| CHF | 0.59% | -0.27% | -0.16% | 0.41% | -0.24% | -0.19% | -0.11% |
The heat map shows percentage changes of major currencies against each other. The base currency is picked from the left column, while the quote currency is picked from the top row. For example, if you pick the British Pound from the left column and move along the horizontal line to the US Dollar, the percentage change displayed in the box will represent GBP (base)/USD (quote).
Forex News
Keep up with the financial markets, know what's happening and what is affecting the markets with our latest market updates. Analyze market movers, trends and build your trading strategies accordingly.
