
USD/JPY Price Analysis: Support around 137.50 caps the USD losses
- The Japanese Yen strengthened against the US Dollar amid a deteriorated mood.
- USD/JPY Price Analysis: Downward biased, but failure to reclaim 137.50 could exacerbate a rally to 140.00.
The US Dollar (USD) falls against the Japanese Yen (JPY) amid a risk-off sentiment as shown by US equities trading in the red, while US Treasury yields rise and the USD remains on the back foot. At the time of writing, the USD/JPY is trading at 138.39 after hitting a daily high of 139.35.
USD/JPY Price Analysis: Technical outlook
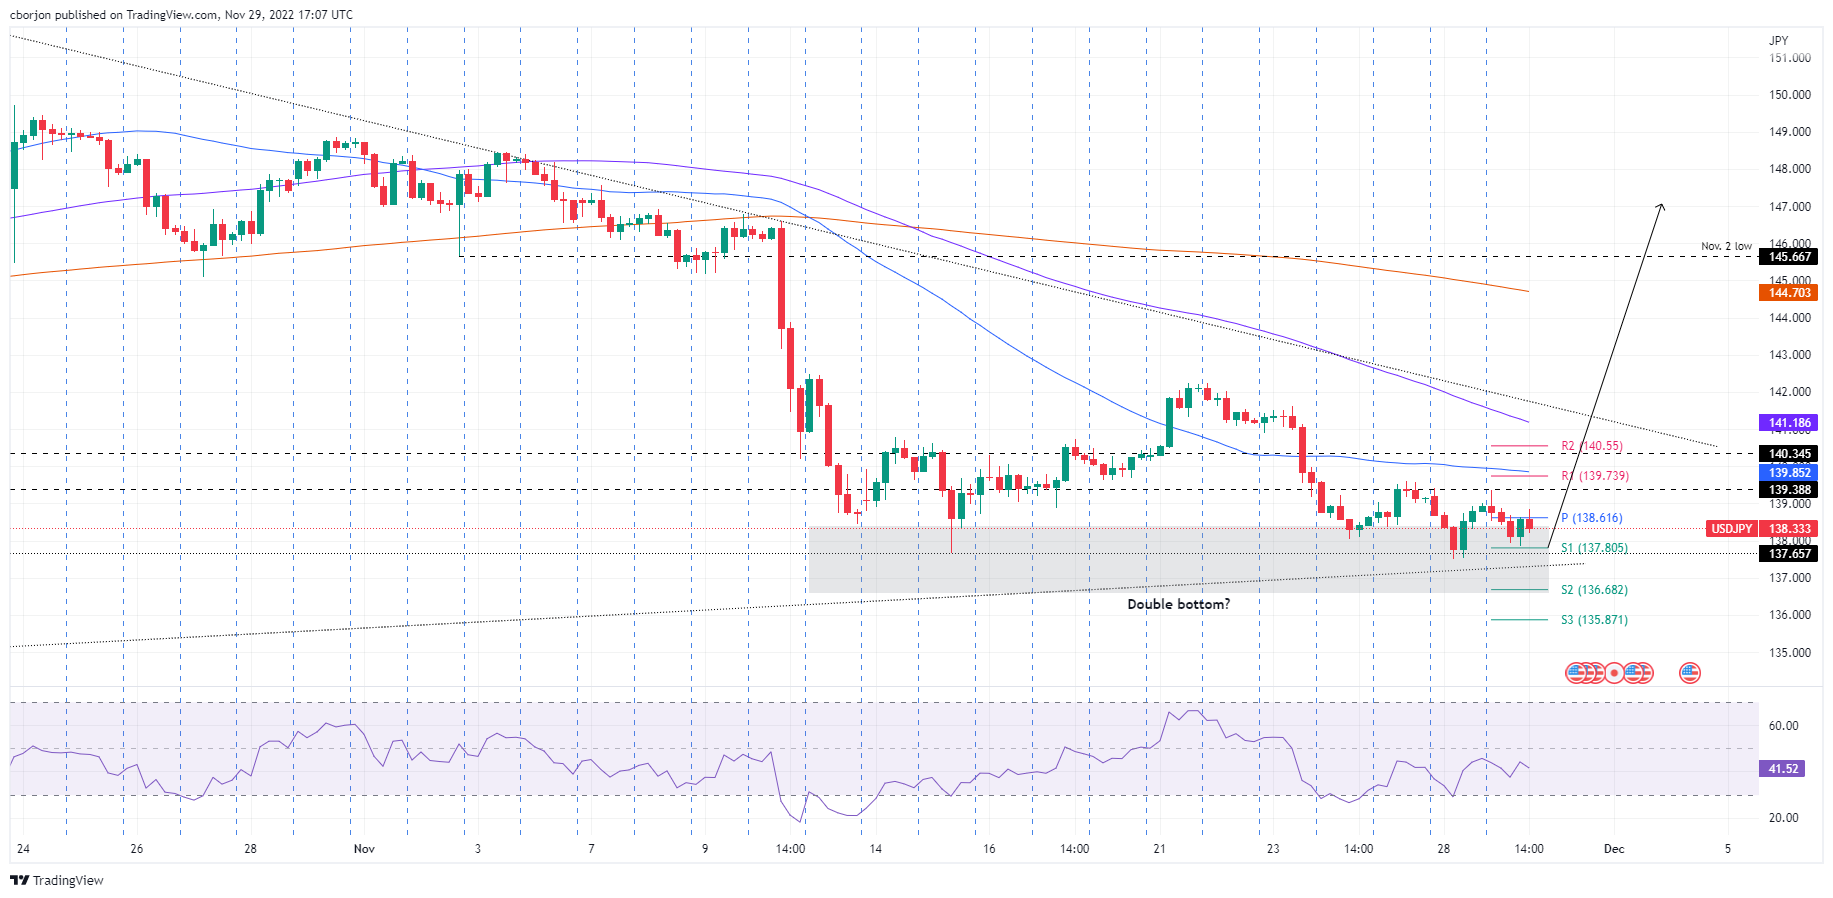
Following Monday’s price action that formed a hammer with an extended bottom wick, the USD/JPY registered moderate losses though stays above the psychological 138.00 figure. It should be noted that the 50 and 100-day Exponential Moving Averages (EMAs) slopes are getting flat, meaning the pair is trendless, stuck within the 137.00-139.50 area. Furthermore, the Relative Strength Index (RSI) at 34.20 turned flat.
Short-term, the USD/JPY 4-hour chart is downward biased, trading below the 50, 100, and 200 (EMAs) ordered in a perfectly bearish way. The USD/JPY faces solid support at the S1 daily pivot point at 137.80. Traders should be aware that a five-month-old upslope trendline passes around 137.50, which, once cleared, could open the door towards the 137.00 figure, followed by the S2 daily pivot at 136.68 and the S3 pivot level at 135.87.
On the flip side, the USD/JPY first resistance would be the daily pivot at 138.61. Break above will expose the confluence of the R1 daily pivot and the 50-EMA at 139.73/85, followed by the 140.00 psychological level, ahead of the R3 daily pivot point at 140.55.
USD/JPY Key Technical Levels
Forex News
Keep up with the financial markets, know what's happening and what is affecting the markets with our latest market updates. Analyze market movers, trends and build your trading strategies accordingly.