NZD/USD Price Analysis: Aims to surpass 0.6100 as street anticipates a neutral Fed policy
- NZD/USD is looking to cross the crucial resistance of 0.6100 amid a fresh sell-off in the USD Index.
- Investors are anticipating that easing US labor market conditions are going to allow the Fed to pause raising rates in June.
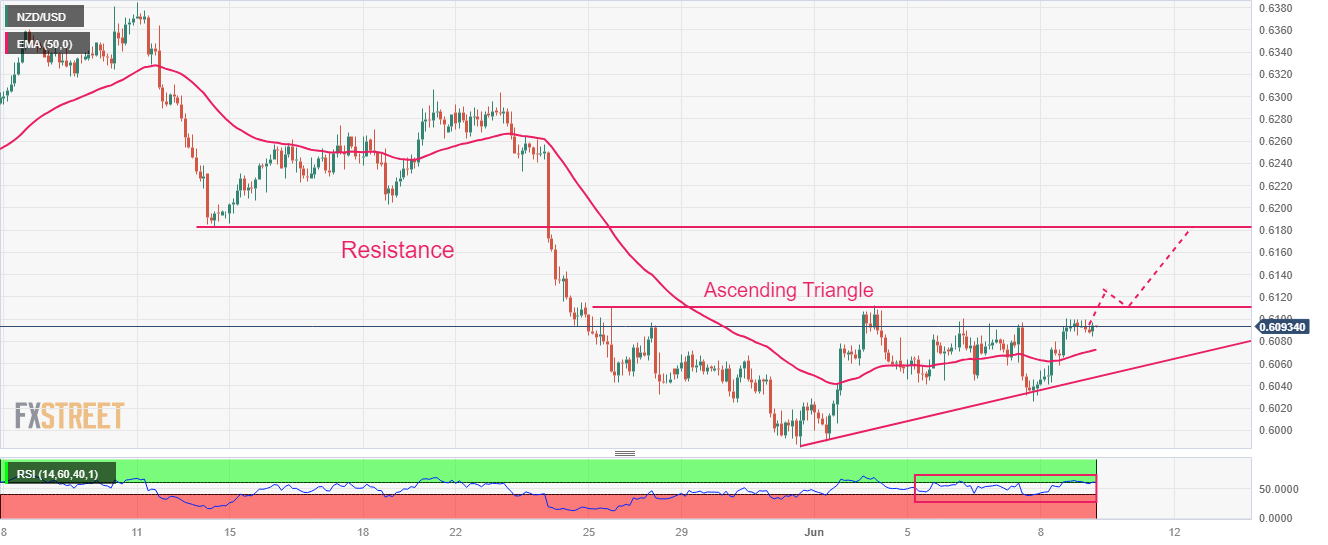
- NZD/USD is approaching the horizontal resistance of the Ascending Triangle chart pattern.
The NZD/USD pair has delivered a solid recovery from 0.6085 in the early European session. The Kiwi asset is aiming to recapture the round-level resistance of 0.6100 as the US Dollar Index (DXY) has retreated after a short-lived pullback to near 103.42.
The USD Index has come under pressure as investors are anticipating that easing United States labor market conditions are going to allow the Federal Reserve (Fed) to pause raising interest rates in June.
The New Zealand Dollar has not loosened its strength despite deflation in the Chinese economy. On a monthly basis, the Chinese economy has registered deflation by 0.2% against the estimates and the prior release of 0.1% deflation. This indicates a sheer drop in the overall demand. It is worth noting that New Zealand is one of the leading trading partners of China and weak demand in China impacts the New Zealand Dollar.
NZD/USD is approaching the horizontal resistance of the Ascending Triangle chart pattern plotted from May 25 high at 0.6110. Upward-sloping trendline of the aforementioned chart pattern is placed from May 31 low at 0.5985. The 50-period Exponential Moving Average (EMA) at 0.6073 has turned straight, portraying a non-directional performance. Critical resistance is plotted from May 12 low at 0.6182.
The Relative Strength Index (RSI) (14) is making efforts for shifting into the bullish range of 60.00-80.00, which would trigger the upside momentum.
A confident break above May 25 high at 0.6110 will drive the Kiwi asset toward May 01 low at 0.6160 followed by the round-level resistance at 0.6200.
Alternatively, a downside move below the intraday low at 0.6015 will expose the asset for a fresh six-month low toward 11 November 2022 low at 0.5984. A slippage below the latter would expose the asset toward 02 November 2022 high at 0.5941.
NZD/USD two-hour chart
Forex News
Keep up with the financial markets, know what's happening and what is affecting the markets with our latest market updates. Analyze market movers, trends and build your trading strategies accordingly.