GBP/USD Price Forecast: Touches new yearly high but diverging with momentum
- GBP/USD rallies to new high for 2024 on Thursday. The trend is bullish.
- A bearish divergence with momentum, however, indicates an increased risk of a temporary setback.
GBP/USD has rallied to a new high for 2024 on Thursday; the pair reached 1.3314 during trading on Thursday, its highest price for the year.
The short, medium and long-term trends are bullish suggesting the current is flowing north. It is a principle of technical analysis that “the trend is your friend” so the odds favor still more upside.
GBP/USD Daily Chart
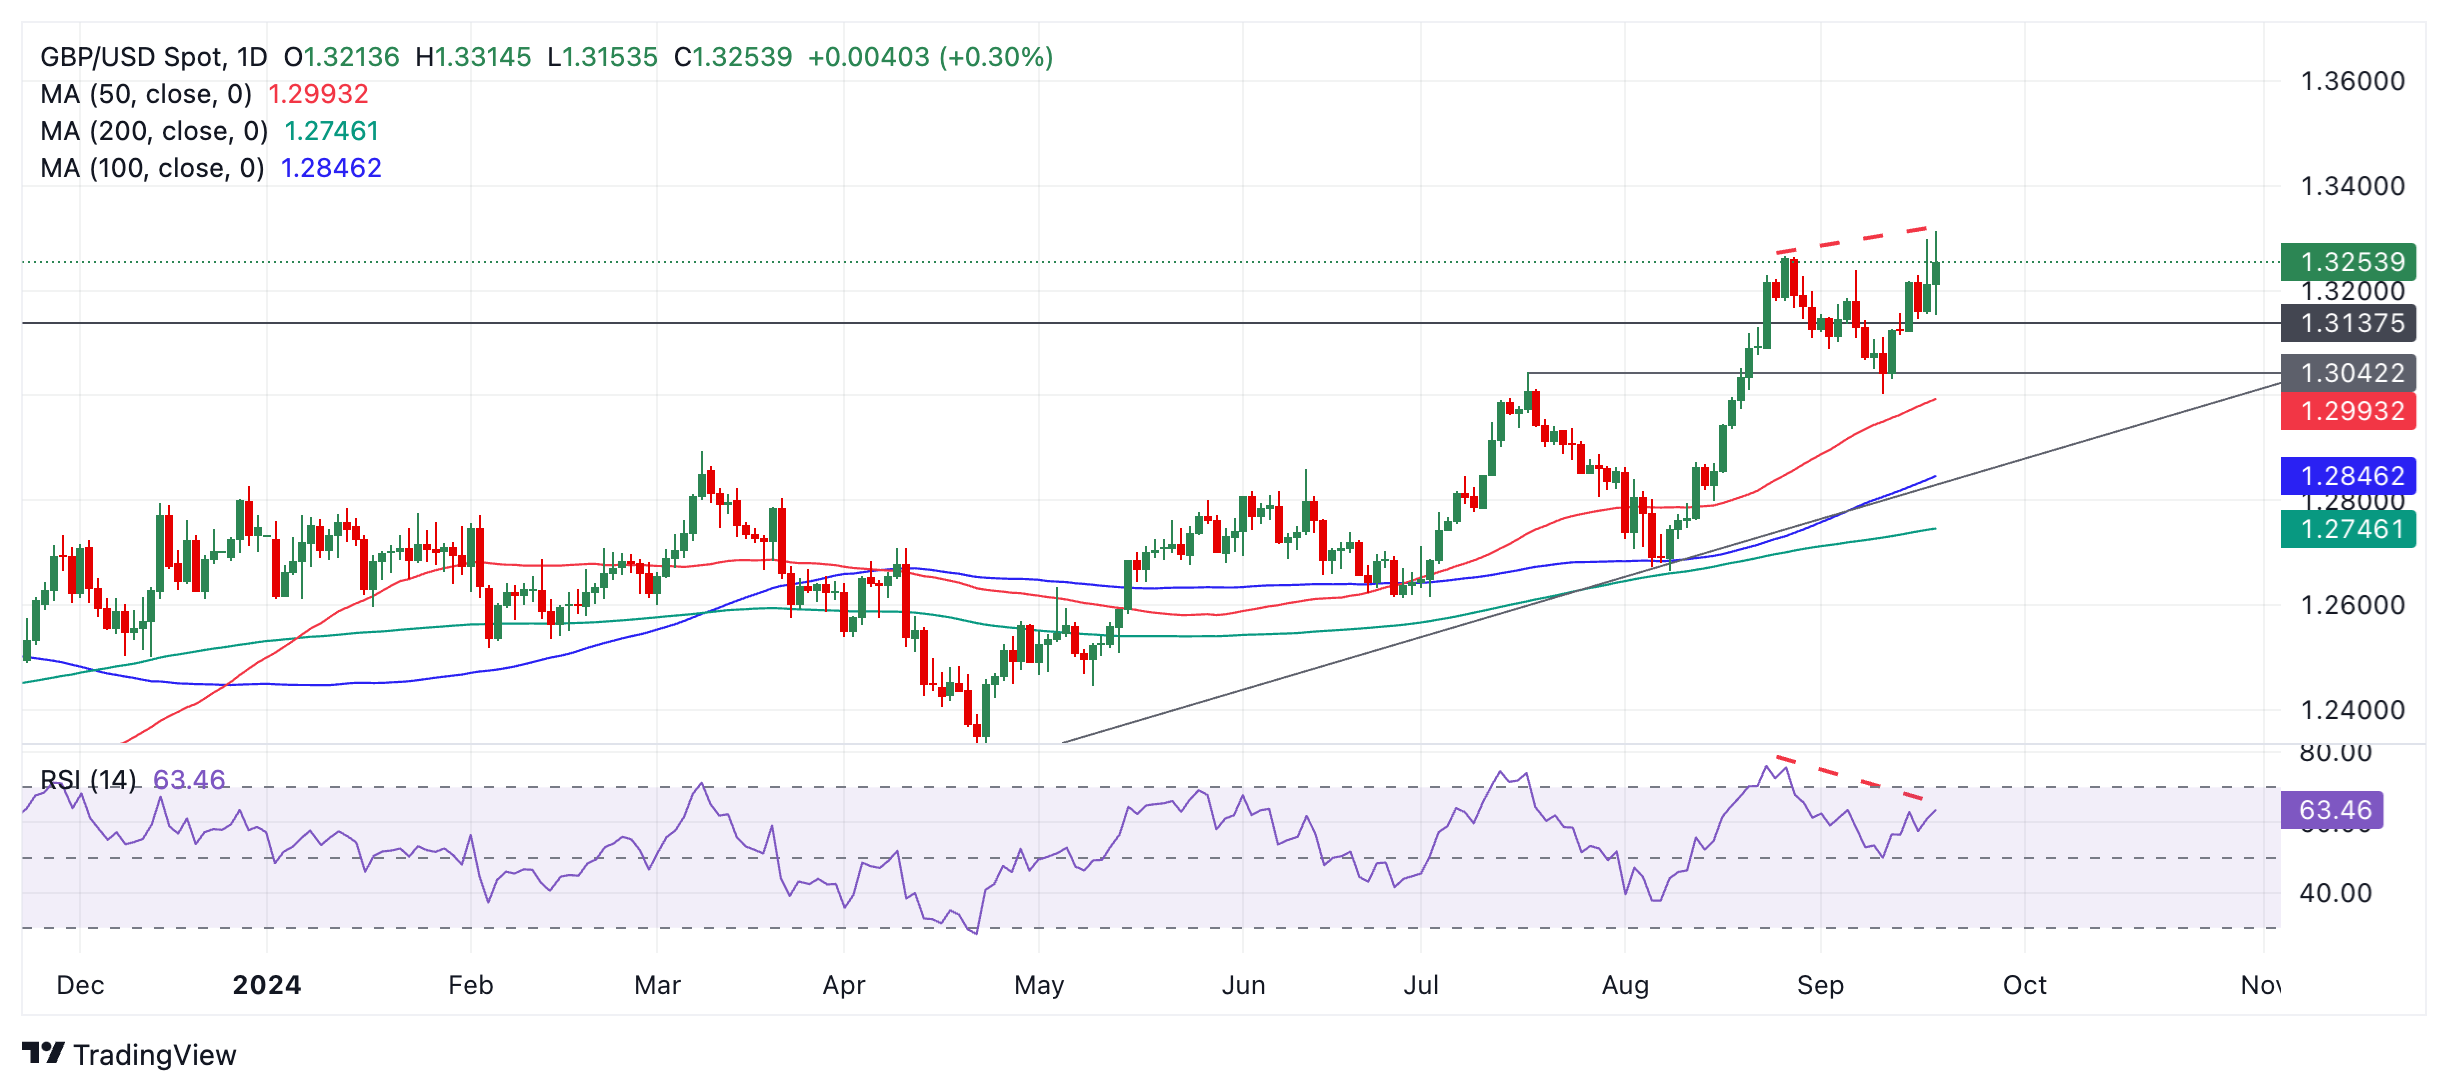
A break above 1.3314 would confirm more upside, targeting 1.3350 and then 1.3400.
However, price is showing bearish divergence with the Relative Strength Index (RSI) momentum indicator (red dashed lines on chart above). This happens when the price reaches a new high but the RSI does not. The non confirmation is a bearish sign as it indicates underlying weakness. There is an increased risk GBP/USD could pull back.
If the pair pulls back it will probably only be temporary as all three trend timeframes are bullish. Support at 1.3137 is likely to catch falling prices, or if not at 1.3042 (July 18 high).
Forex News
Keep up with the financial markets, know what's happening and what is affecting the markets with our latest market updates. Analyze market movers, trends and build your trading strategies accordingly.