
Japanese Yen climbs to the top end of its daily range against USD; bullion potential seems intact
- The Japanese Yen attracts some dip-buyers and stalls its pullback from a multi-month low against the USD.
- Hopes for a US-Japan trade deal and rising bets for more BoJ rate hikes in 2025 continue to underpin the JPY.
- A positive turnaround in the global risk sentiment keeps a lid on any meaningful gains for the safe-haven JPY.
The Japanese Yen (JPY) recovers early lost ground to a one-week trough touched against its American counterpart earlier this Wednesday and climbs to the top end of the daily range heading into the European session. The initial market reaction to mixed PMIs from Japan turns out to be short-lived amid reports that the US and Japan are moving closer to an interim arrangement on trade. Adding to this, the growing acceptance that the Bank of Japan (BoJ) will continue raising interest rates in 2025 helps revive demand for the JPY.
Apart from this, bets for more aggressive policy easing by the Federal Reserve (Fed) cap the US Dollar (USD) recovery from a multi-year low and contribute to the USD/JPY pair's pullback of nearly 150 pips from levels beyond the 143.00 mark. That said, the upbeat market mood, bolstered by signs of a potential de-escalation of the ongoing tariff dispute with China and easing geopolitical tensions, might hold back bulls from placing fresh bets around the JPY. Traders now look forward to the global PMIs for short-term opportunities.
Japanese Yen bulls might refrain from placing fresh bets amid receding safe-haven demand
- The global risk sentiment gets a strong boost after US Treasury Secretary Scott Bessent said at a private investor summit that the tit-for-tat tariff war between the US and China would de-escalate soon. Later, White House spokeswoman Karoline Leavitt told reporters that the Trump administration is setting the stage for a deal. This, in turn, contributes to improving investors' appetite for riskier assets and driving flows away from perceived safe-haven assets, including the Japanese Yen.
- Meanwhile, US President Donald Trump ruled out the possibility of taking the unprecedented step of firing Federal Reserve Chair Jerome Powell before the expiry of his term in May 2026. This, in turn, triggers a goodish US Dollar recovery from a three-year low, which assists the USD/JPY pair to attract some follow-through buyers during the Asian session on Wednesday. The USD move up, however, runs out of steam amid the prospects for more aggressive policy easing by the Fed.
- According to the CME Group's FedWatch Tool, traders are pricing in the possibility that the Fed will lower borrowing costs by 25 basis points in June and deliver at least three rate cuts by the end of this year. This marks a big divergence in comparison to a rising consensus that the Bank of Japan will continue hiking interest rates in 2025. Apart from this, the hope that Japan might strike a trade deal with the US helps limit the JPY losses and prompt some intraday selling around the USD/JPY pair.
- In fact, the new US ambassador to Japan said last Friday that he is optimistic about a deal in the ongoing US-Japan tariff negotiations. However, Japan's Economic Revitalization Minister Ryosei Akazawa said that any agreement would likely take some time as it's difficult to say how long it will take to bridge the gap between the two sides. Akazawa could visit US for tariff talks as early as April 30, TV Asahi reports, warranting some caution for the JPY bears.
- Meanwhile, the preliminary Purchasing Managers' Index (PMI) released earlier this Wednesday showed that Japanese manufacturing activity has shrunk for the tenth consecutive month in April. The au Jibun Bank manufacturing PMI came in at 48.5 in April, slightly higher compared to 48.4 in the previous month. In contrast, Japanese services activity rebounded and the au Jibun Bank Services PMI rose to 52.2 during the reported month compared to a neutral reading of 50.0 in March.
- Wednesday's economic docket also features the release of flash global PMIs, which might provide a fresh insight into the global economic health. Apart from this, trade-related developments would play a key role in influencing the broader market risk sentiment and driving demand for the safe-haven JPY.
USD/JPY could resume downtrend below the Asian session low, around the 141.45 area
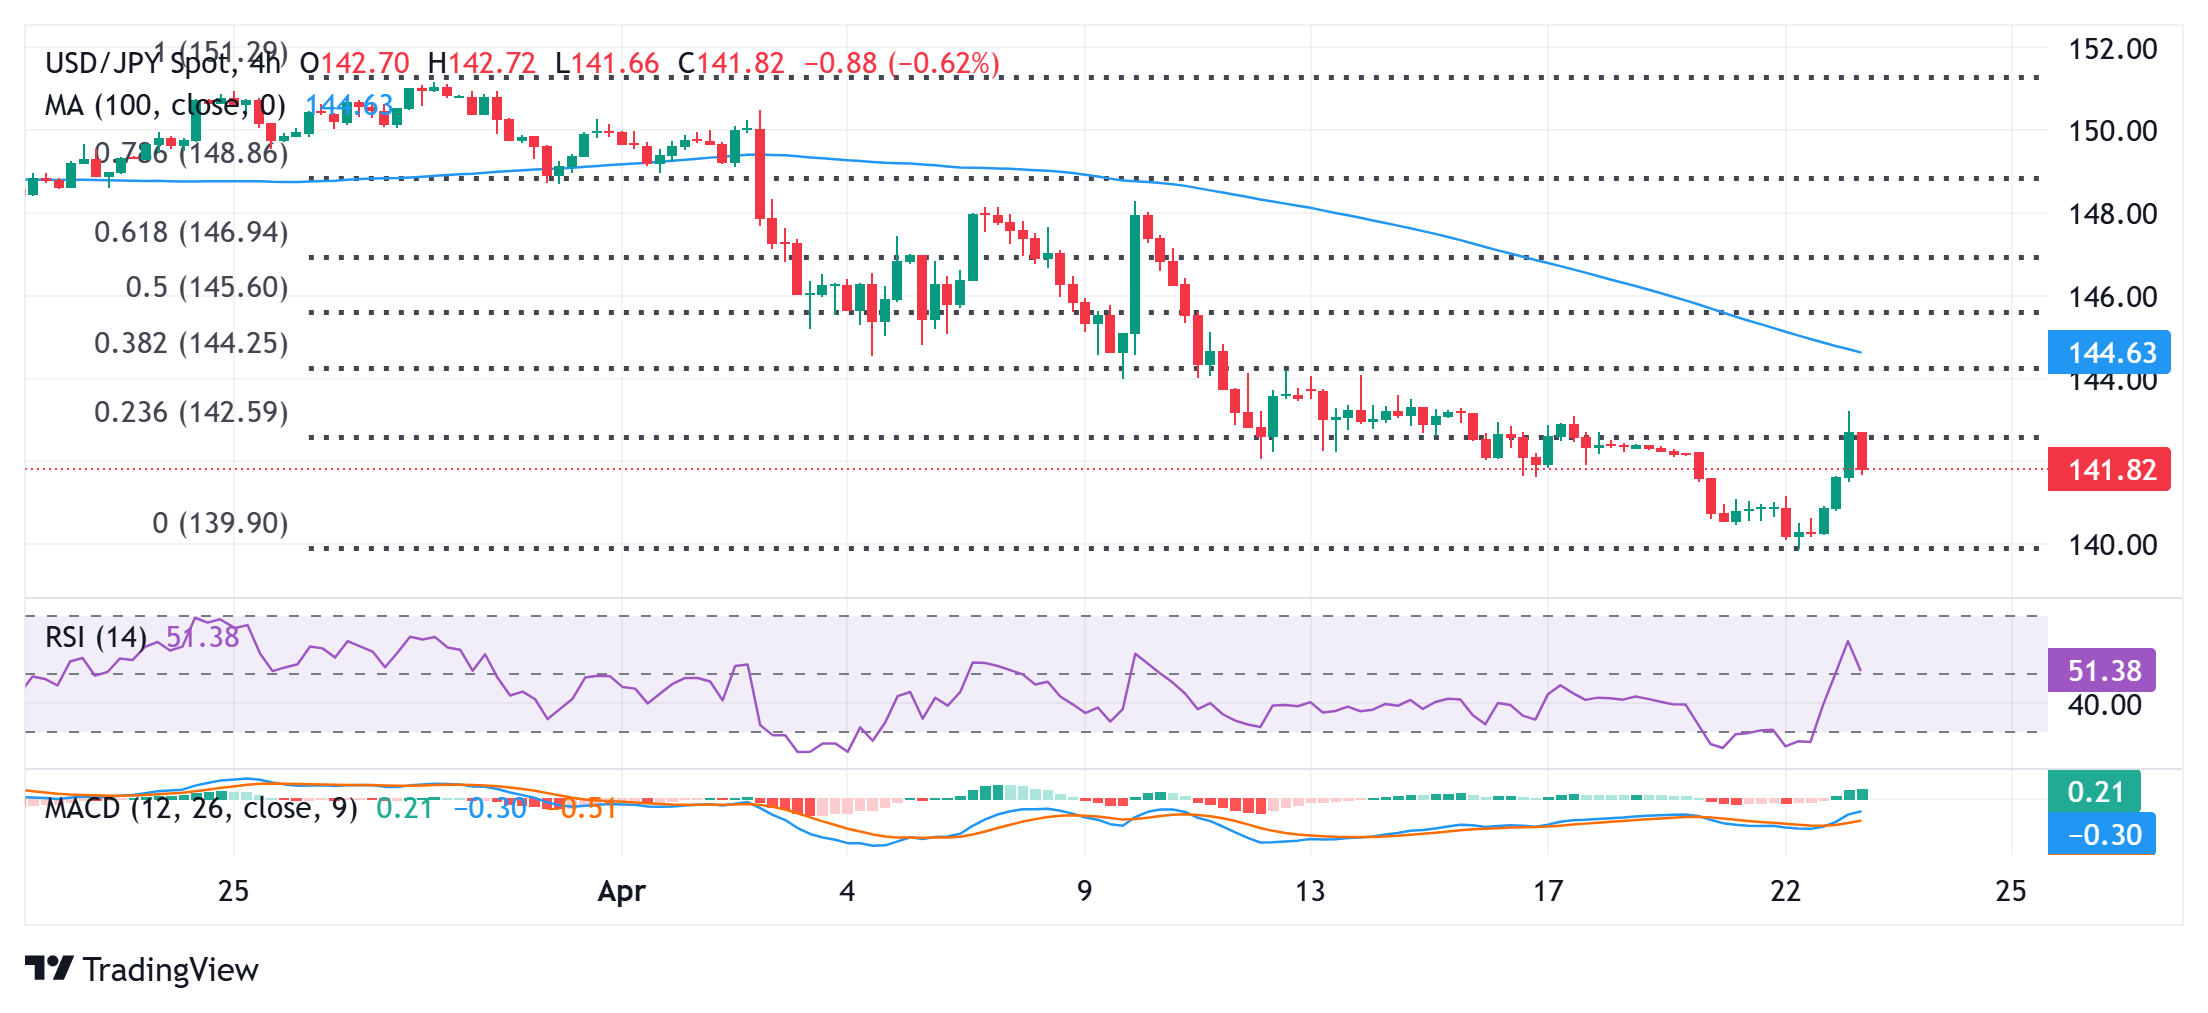
From a technical perspective, the USD/JPY pair showed some resilience below the 140.00 psychological mark on Tuesday and the subsequent short-covering rally warrants some caution for bearish traders. The recovery momentum, however, struggles to find acceptance above the 143.00 mark or the 23.6% Fibonacci retracement level of the March-April downfall. This, in turn, should now act as a key pivotal point, above which spot prices might aim to surpass the Asian session peak, around the 143.20 area, and climb further towards reclaiming the 144.00 mark. The momentum could extend further towards the 144.25-144.30 region or the 38.2% Fibo. level.
On the flip side, weakness below the 141.45 zone, or the Asian session low, now seems to find decent support near the 141.00 mark. A convincing break below the latter, however, will suggest that the recent downtrend is still far from being over and make the USD/JPY pair vulnerable to retesting sub-140.00 levels, with some intermediate support near the 140.45 region. The subsequent downfall would expose the 2024 swing low, around the 139.60-139.55 area.
US Dollar PRICE Today
The table below shows the percentage change of US Dollar (USD) against listed major currencies today. US Dollar was the strongest against the Swiss Franc.
| USD | EUR | GBP | JPY | CAD | AUD | NZD | CHF | |
|---|---|---|---|---|---|---|---|---|
| USD | 0.32% | 0.17% | 0.17% | 0.04% | -0.83% | -0.46% | 0.42% | |
| EUR | -0.32% | -0.16% | -0.15% | -0.29% | -1.08% | -0.79% | 0.09% | |
| GBP | -0.17% | 0.16% | 0.02% | -0.13% | -0.94% | -0.63% | 0.28% | |
| JPY | -0.17% | 0.15% | -0.02% | -0.15% | -0.90% | -0.67% | 0.26% | |
| CAD | -0.04% | 0.29% | 0.13% | 0.15% | -0.76% | -0.48% | 0.41% | |
| AUD | 0.83% | 1.08% | 0.94% | 0.90% | 0.76% | 0.32% | 1.20% | |
| NZD | 0.46% | 0.79% | 0.63% | 0.67% | 0.48% | -0.32% | 0.92% | |
| CHF | -0.42% | -0.09% | -0.28% | -0.26% | -0.41% | -1.20% | -0.92% |
The heat map shows percentage changes of major currencies against each other. The base currency is picked from the left column, while the quote currency is picked from the top row. For example, if you pick the US Dollar from the left column and move along the horizontal line to the Japanese Yen, the percentage change displayed in the box will represent USD (base)/JPY (quote).
Forex News
Keep up with the financial markets, know what's happening and what is affecting the markets with our latest market updates. Analyze market movers, trends and build your trading strategies accordingly.