USD/CHF Price Analysis: 50-DMA challenges bears at two-week low
- USD/CHF remains depressed at the lowest levels in 13 days.
- Clear downside break of one-month-old ascending trend line, the first bearish MACD signal in many days favor Swiss Franc buyers.
- Recovery moves need validation from 100-DMA, RSI suggests continuation of downtrend.
USD/CHF bears take a breather at the lowest level in a fortnight, making rounds to 0.8990 heading into Friday’s European session. In doing so, the Swiss Franc (CHF) pair jostles with the 50-DMA support to extend the previous day’s fall, the biggest in seven months.
It should be noted that the major currency pair’s clear downside break of a one-month-old ascending support line triggered the quote’s major fall on Thursday.
That said, the quote’s latest inaction fails to push back the USD/CHF bears amid the MACD indicator’s first bearish signal since late April, as well as amid the steady RSI (14) line.
Hence, the sellers are to stay on the way to the multi-month low marked in May around 0.8820 even if the 50-DMA support of 0.8988 prods the south-run of late. With this, the Swiss Franc pair sellers may aim for the 0.8800 round figure.
Alternatively, an upside break of the previous support line stretched from early May, around 0.9085, isn’t an open invitation to the USD/CHF bulls.
The reason could be linked to the pair’s U-turn from the 100-DMA and 50% Fibonacci retracement of the March-May fall, respectively near 0.9120 and 0.9135.
USD/CHF: Daily chart
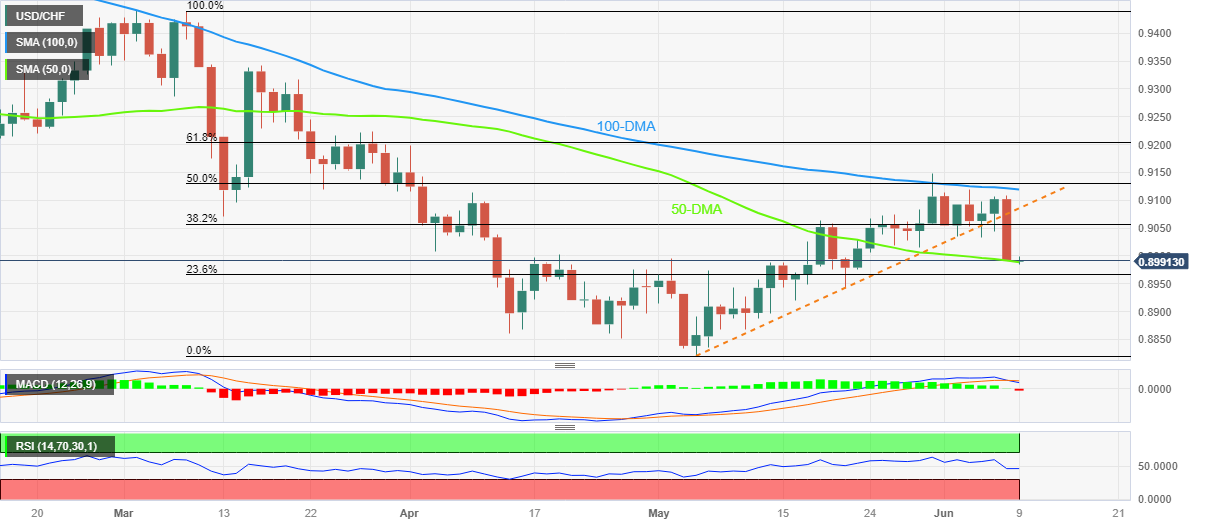
Trend: Further downside expected
Forex News
Keep up with the financial markets, know what's happening and what is affecting the markets with our latest market updates. Analyze market movers, trends and build your trading strategies accordingly.