
NZD/USD Price Forecast: Holds position above 0.5700 near 50-day EMA support
- NZD/USD trades within the consolidation phase, with the pair moving within a rectangular pattern.
- A bullish shift would be indicated if the 9-day EMA successfully breaks above the 50-day EMA.
- The immediate support appears at the 50-day EMA of 0.5697 level, aligned with the nine-day EMA at 0.5696 level.
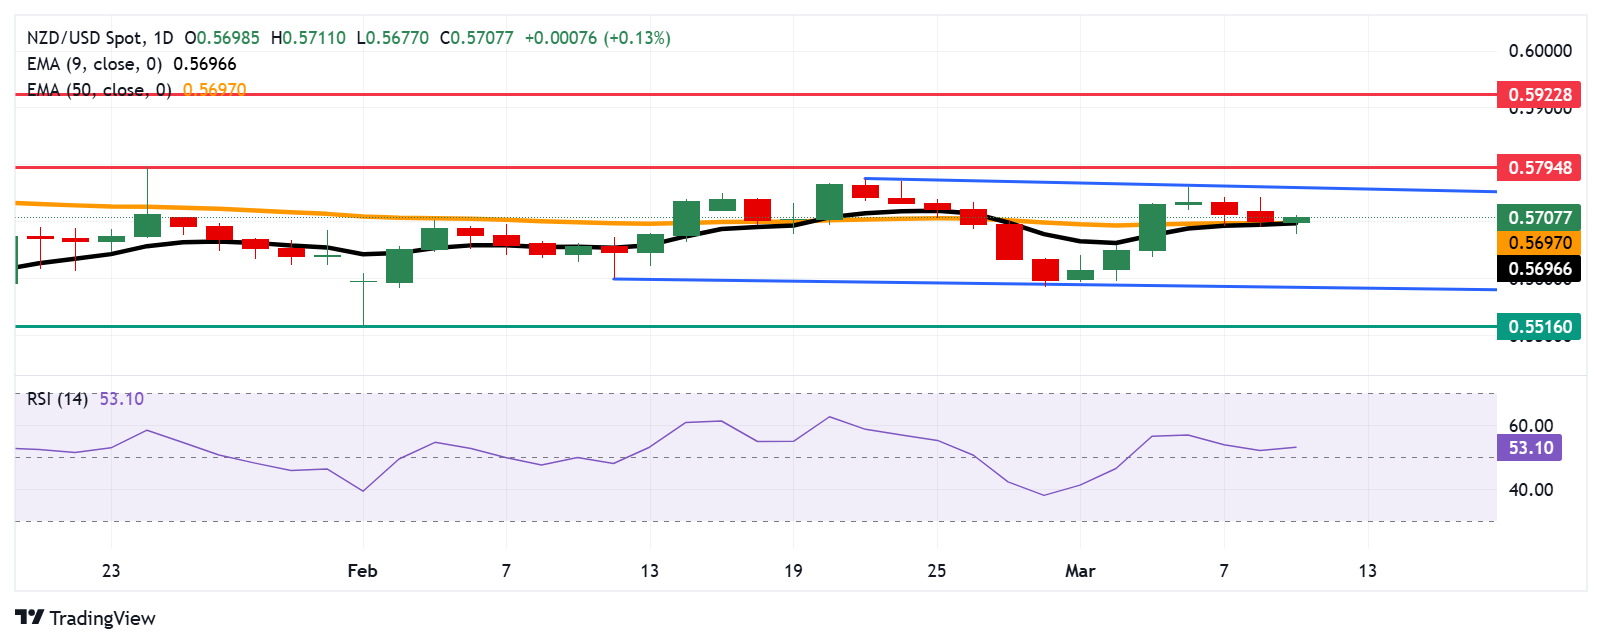
The NZD/USD pair holds gains after recovering daily losses, trading around 0.5710 during European trading hours on Tuesday. Technical analysis of the daily chart indicates a consolidation phase, with the pair moving within a rectangular pattern.
Additionally, nine-day and 50-day Exponential Moving Average (EMA) align together, it generally signals a period of equilibrium in the market where short-term and medium-term trends are converging. The 9-day EMA was below and is now attempting to break above the 50-day EMA, it might signal a bullish shift if it eventually crosses above.
However, the 14-day Relative Strength Index (RSI) remains above the 50 mark, suggesting that bullish bias is in play.
On the upside, the NZD/USD pair could test the upper trendline of the rectangle at 0.5760 level, followed by the three-month high of 0.5794, reached on January 24. A break above this crucial resistance zone could cause the emergence of the bullish bias and support the NZD/USD pair to explore the region around the four-month high at 0.5922 level, recorded in December 2024.
The immediate support is seen at the 50-day EMA of 0.5697 level, aligned with the nine-day EMA at 0.5696 level. A successful break below these levels could weaken the short-term price momentum and put downward pressure on the NZD/USD pair to test the psychological level of 0.5600, followed by the lower trendline of the rectangle at 0.5590 level. Further support appears around 0.5516—its lowest level since October 2022, recorded on February 3.
NZD/USD: Daily Chart
New Zealand Dollar PRICE Today
The table below shows the percentage change of New Zealand Dollar (NZD) against listed major currencies today. New Zealand Dollar was the strongest against the US Dollar.
| USD | EUR | GBP | JPY | CAD | AUD | NZD | CHF | |
|---|---|---|---|---|---|---|---|---|
| USD | -0.68% | -0.38% | -0.03% | -0.14% | -0.19% | -0.13% | -0.05% | |
| EUR | 0.68% | 0.31% | 0.67% | 0.55% | 0.48% | 0.56% | 0.64% | |
| GBP | 0.38% | -0.31% | 0.34% | 0.24% | 0.18% | 0.22% | 0.34% | |
| JPY | 0.03% | -0.67% | -0.34% | -0.12% | -0.18% | -0.12% | -0.02% | |
| CAD | 0.14% | -0.55% | -0.24% | 0.12% | -0.05% | 0.00% | 0.09% | |
| AUD | 0.19% | -0.48% | -0.18% | 0.18% | 0.05% | 0.07% | 0.15% | |
| NZD | 0.13% | -0.56% | -0.22% | 0.12% | -0.00% | -0.07% | 0.09% | |
| CHF | 0.05% | -0.64% | -0.34% | 0.02% | -0.09% | -0.15% | -0.09% |
The heat map shows percentage changes of major currencies against each other. The base currency is picked from the left column, while the quote currency is picked from the top row. For example, if you pick the New Zealand Dollar from the left column and move along the horizontal line to the US Dollar, the percentage change displayed in the box will represent NZD (base)/USD (quote).
Forex News
Keep up with the financial markets, know what's happening and what is affecting the markets with our latest market updates. Analyze market movers, trends and build your trading strategies accordingly.