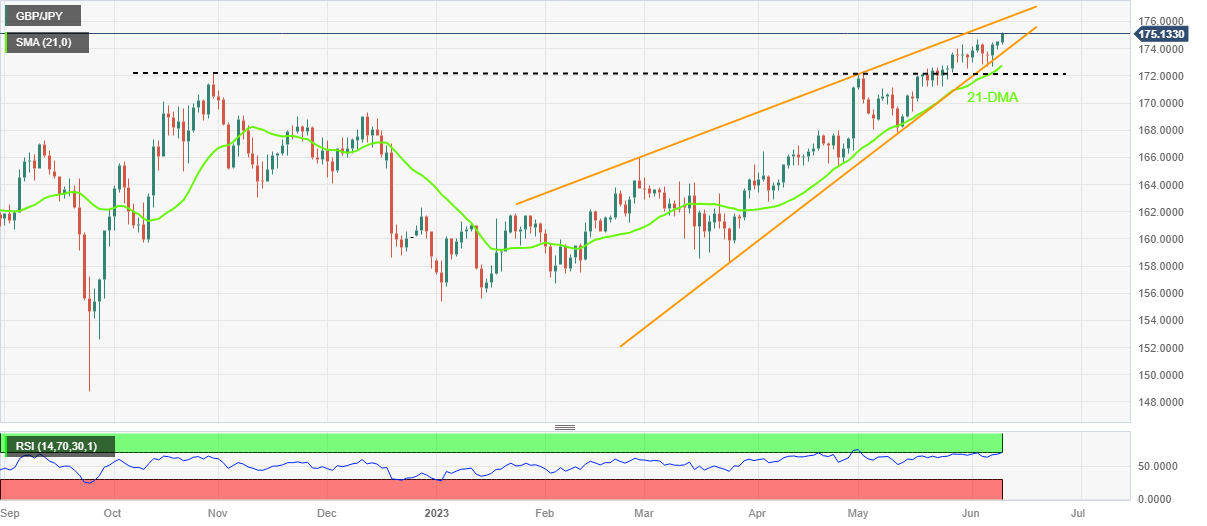
GBP/JPY Price Analysis: Renews seven-year high above 175.00 on UK growth optimism, upbeat yields
- GBP/JPY takes the bids to refresh multi-month high during three-day winning streak.
- Hesitance in confirming 14-week-old rising wedge, clear break of seven-month-long horizontal resistance-turned-support favor bulls.
- Overbought RSI can trigger pullback moves; wedge’s top line challenges buyers.
GBP/JPY stays on the front foot for the third consecutive day around 175.20 as it rises to the fresh high since January 2016 heading into Friday’s London open. In doing so, the cross-currency pair justifies the early week’s rebound from a lower line of the rising wedge bearish chart pattern established in late February.
Apart from the previous rebound within a bearish chart formation, the quote’s successful trading beyond the seven-week-old horizontal resistance, now support around 172.00, also favors the GBP/JPY bulls as the key to refreshing the multi-year high.
It should be noted, however, that the overbought RSI (14) line, challenges the GBP/JPY bulls.
Apart from the overbought RSI, the top line of the aforementioned multi-day-old rising wedge, near 176.20, can also challenge the cross-currency pair.
Hence, the GBP/JPY pair traders are likely to remain bullish unless witnessing a sure confirmation of the bearish chart formation, by downside concurrence of the said wedge’s lower line, close to 173.80 at the latest.
Even so, the 21-DMA level of around 172.75 can act as an extra filter towards the south for the pair sellers ahead of the previous resistance line area surrounding 172.00.
Fundamentally, the British Chambers of Commerce (BCC) said that the UK economy will probably skirt a recession but sputter through “anemic” growth in the year ahead due to lingering inflation, per Bloomberg. On the other hand, the US Treasury bond yields as the benchmark 10-year and two-year Treasury bond yields remain sidelined near 3.73% and 4.52% respectively, after reversing from the highest levels in a fortnight and snapping a two-day winning streak in that order the previous day.
Also read: GBP/JPY jumps to the highest level since 2016, around 174.80 region
GBP/JPY: Daily chart
Trend: Limited upside expected
Forex News
Keep up with the financial markets, know what's happening and what is affecting the markets with our latest market updates. Analyze market movers, trends and build your trading strategies accordingly.