Japanese Yen receives downward pressure due to solid US Dollar ahead of Nonfarm Payrolls
- The Japanese Yen depreciated following the release of Manufacturing PMI on Friday.
- The headline Jibun Bank Japan Manufacturing PMI registered at 49.2 in October, reflecting a decrease from 49.7 in September.
- US Nonfarm Payrolls are expected to increase by 113,000 jobs in October, a decline from the previous count of 254,000.
The Japanese Yen (JPY) retraces some of its recent gains following the release of the Manufacturing Purchasing Managers Index (PMI) by Jibun Bank and S&P Global on Friday. However, the USD/JPY pair declined as the JPY strengthened after post-meeting comments from Bank of Japan (BoJ) Governor Kazuo Ueda on Thursday, which were seen as increasing the likelihood of a rate hike in December.
The headline au Jibun Bank Japan Manufacturing PMI stood at 49.2 in October, indicating a decline from 49.7 in September. This composite single-figure indicator shows that Japanese manufacturing production continued to decline at the beginning of the fourth quarter of 2024, with both output and new order inflows decreasing at more pronounced rates.
Japan's Chief Cabinet Secretary Yoshimasa Hayashi stated on Friday that he anticipates the Bank of Japan will collaborate closely with the government to implement appropriate monetary policy aimed at achieving its price target in a sustainable and stable manner.
Traders are anticipating the release of the US Nonfarm Payrolls (NFP) report on Friday, with expectations that the US economy added 113,000 jobs in October, while the Unemployment Rate is forecasted to remain steady at 4.1%.
Daily Digest Market Movers: Japanese Yen depreciates despite increased odds of BoJ rate hikes
- The USD/JPY pair gains ground as the US Dollar (USD) breaks its four-day losing streak due to ongoing market caution amid uncertainty leading up to the upcoming US presidential election. However, the Greenback encountered difficulties following the release of the Personal Consumption Expenditures (PCE) Price Index data on Thursday.
- The US Personal Consumption Expenditures (PCE) Price Index showed that core inflation increased by 2.7% year-over-year in September. Additionally, Initial Jobless Claims dropped to a five-month low of 216,000 for the week ending October 25, signaling a robust labor market and lessening expectations for imminent rate cuts by the Federal Reserve (Fed).
- The Bank of Japan decided to keep its short-term interest rate target at 0.25% following the conclusion of its two-day monetary policy review on Thursday. This decision was in line with market expectations for maintaining stability.
- According to the BoJ Outlook Report for Q3, the central bank plans to continue raising policy rates as long as the economy and prices align with its forecasts, particularly given that real interest rates are currently very low. The Bank of Japan aims to conduct monetary policy with a focus on sustainably and stably achieving its 2% inflation target.
- US Gross Domestic Product (GDP) annualized expanded by 2.8% in Q3, below 3.0% in Q2 and forecasts of 3.0%. The ADP Employment Change report showed that 233,000 new workers were added in October, marking the largest increase since July 2023. This followed an upward revision to 159,000 in September and significantly exceeded forecasts of 115,000.
- On Tuesday, the US Bureau of Labor Statistics (BLS) reported that JOLTS Job Openings reached 7.443 million in September, down from 7.861 million in August and falling short of the market expectation of 7.99 million.
- Japan’s Economy Minister Ryosei Akazawa remarked on Tuesday that a weaker Yen could drive up prices via higher import costs, potentially reducing real household income and dampening private consumption if wage growth does not keep pace.
- Japan’s Liberal Democratic Party (LDP)-coalition lost its parliamentary majority in Sunday's election, which has increased uncertainty regarding the Bank of Japan's (BoJ) rate-hike plans.
Technical Analysis: USD/JPY may re-enter the ascending channel to strengthen its bullish bias
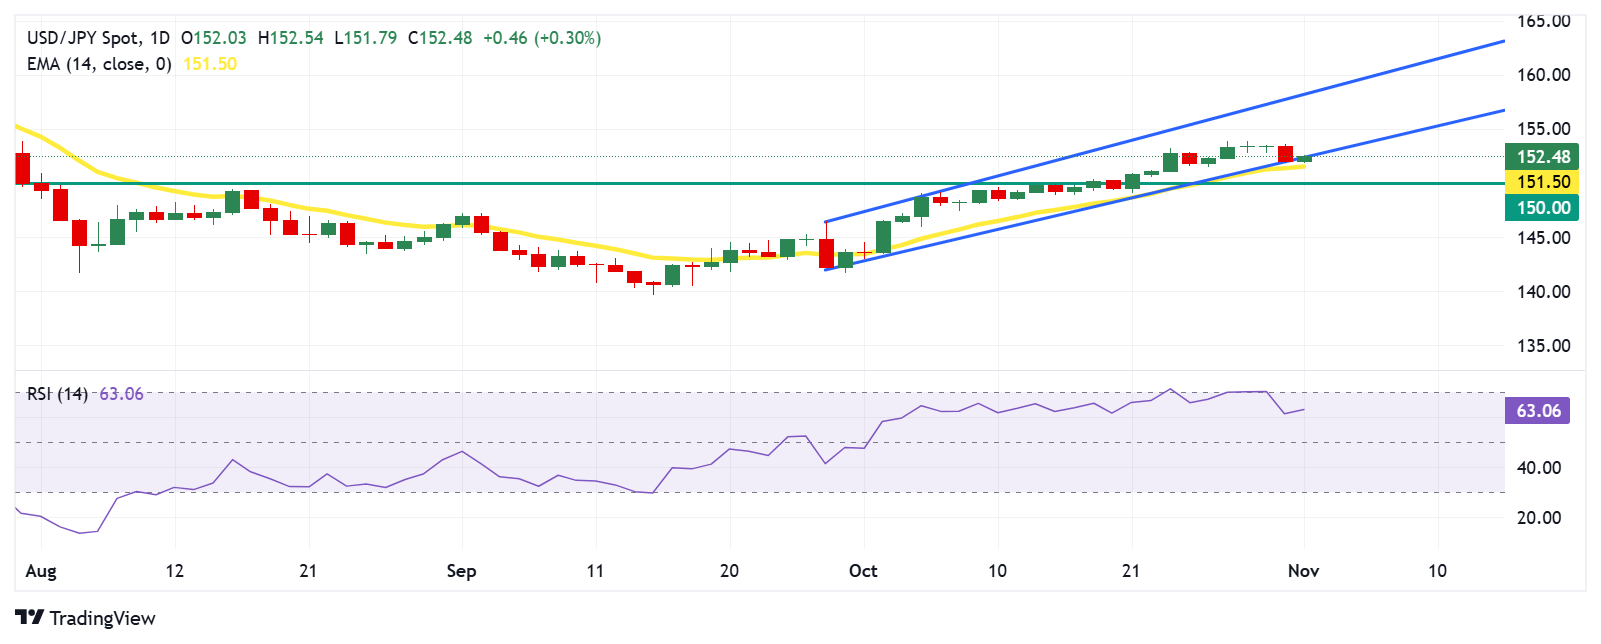
The USD/JPY pair trades around 152.40 on Friday. Daily chart analysis indicates the potential softening of the bullish bias, as the pair has broken below its ascending channel. However, the 14-day Relative Strength Index (RSI) remains above the 50 mark, suggesting that bullish momentum is active.
In terms of resistance, the USD/JPY pair faces resistance at the lower boundary of the ascending channel, which is at the 152.50 level. If the pair successfully re-enters this channel, it could target the upper boundary around the 158.30 level.
On the downside, support for the USD/JPY pair may be found around the 14-day Exponential Moving Average (EMA) at the 151.50 level, with further support around the psychological level of 150.00.
USD/JPY: Daily Chart
Japanese Yen PRICE Today
The table below shows the percentage change of Japanese Yen (JPY) against listed major currencies today. Japanese Yen was the weakest against the British Pound.
| USD | EUR | GBP | JPY | CAD | AUD | NZD | CHF | |
|---|---|---|---|---|---|---|---|---|
| USD | 0.09% | 0.00% | 0.23% | 0.03% | 0.32% | 0.13% | 0.06% | |
| EUR | -0.09% | -0.08% | 0.17% | -0.06% | 0.24% | 0.07% | -0.01% | |
| GBP | -0.01% | 0.08% | 0.24% | 0.02% | 0.31% | 0.14% | 0.03% | |
| JPY | -0.23% | -0.17% | -0.24% | -0.20% | 0.09% | -0.10% | -0.17% | |
| CAD | -0.03% | 0.06% | -0.02% | 0.20% | 0.29% | 0.12% | 0.01% | |
| AUD | -0.32% | -0.24% | -0.31% | -0.09% | -0.29% | -0.18% | -0.31% | |
| NZD | -0.13% | -0.07% | -0.14% | 0.10% | -0.12% | 0.18% | -0.10% | |
| CHF | -0.06% | 0.01% | -0.03% | 0.17% | -0.01% | 0.31% | 0.10% |
The heat map shows percentage changes of major currencies against each other. The base currency is picked from the left column, while the quote currency is picked from the top row. For example, if you pick the Japanese Yen from the left column and move along the horizontal line to the US Dollar, the percentage change displayed in the box will represent JPY (base)/USD (quote).
Forex News
Keep up with the financial markets, know what's happening and what is affecting the markets with our latest market updates. Analyze market movers, trends and build your trading strategies accordingly.
