
US Dollar Price Forecast: Initial support level emerges below 107.00
- The US Dollar Index weakens to near 107.25 in Monday’s early European session.
- The positive outlook of the DXY remains intact above the 100-day EMA, but further consolidation cannot be ruled out.
- The immediate resistance level emerges at 108.45; the first support level is seen at 106.70.
The US Dollar Index (DXY) faces some selling pressure to near 107.25, snapping the three-day winning streak during the early European session on Monday. The rising expectation that the US Federal Reserve (Fed) will cut interest rates by a quarter of a percentage point twice by the end of this year drags the DXY lower.
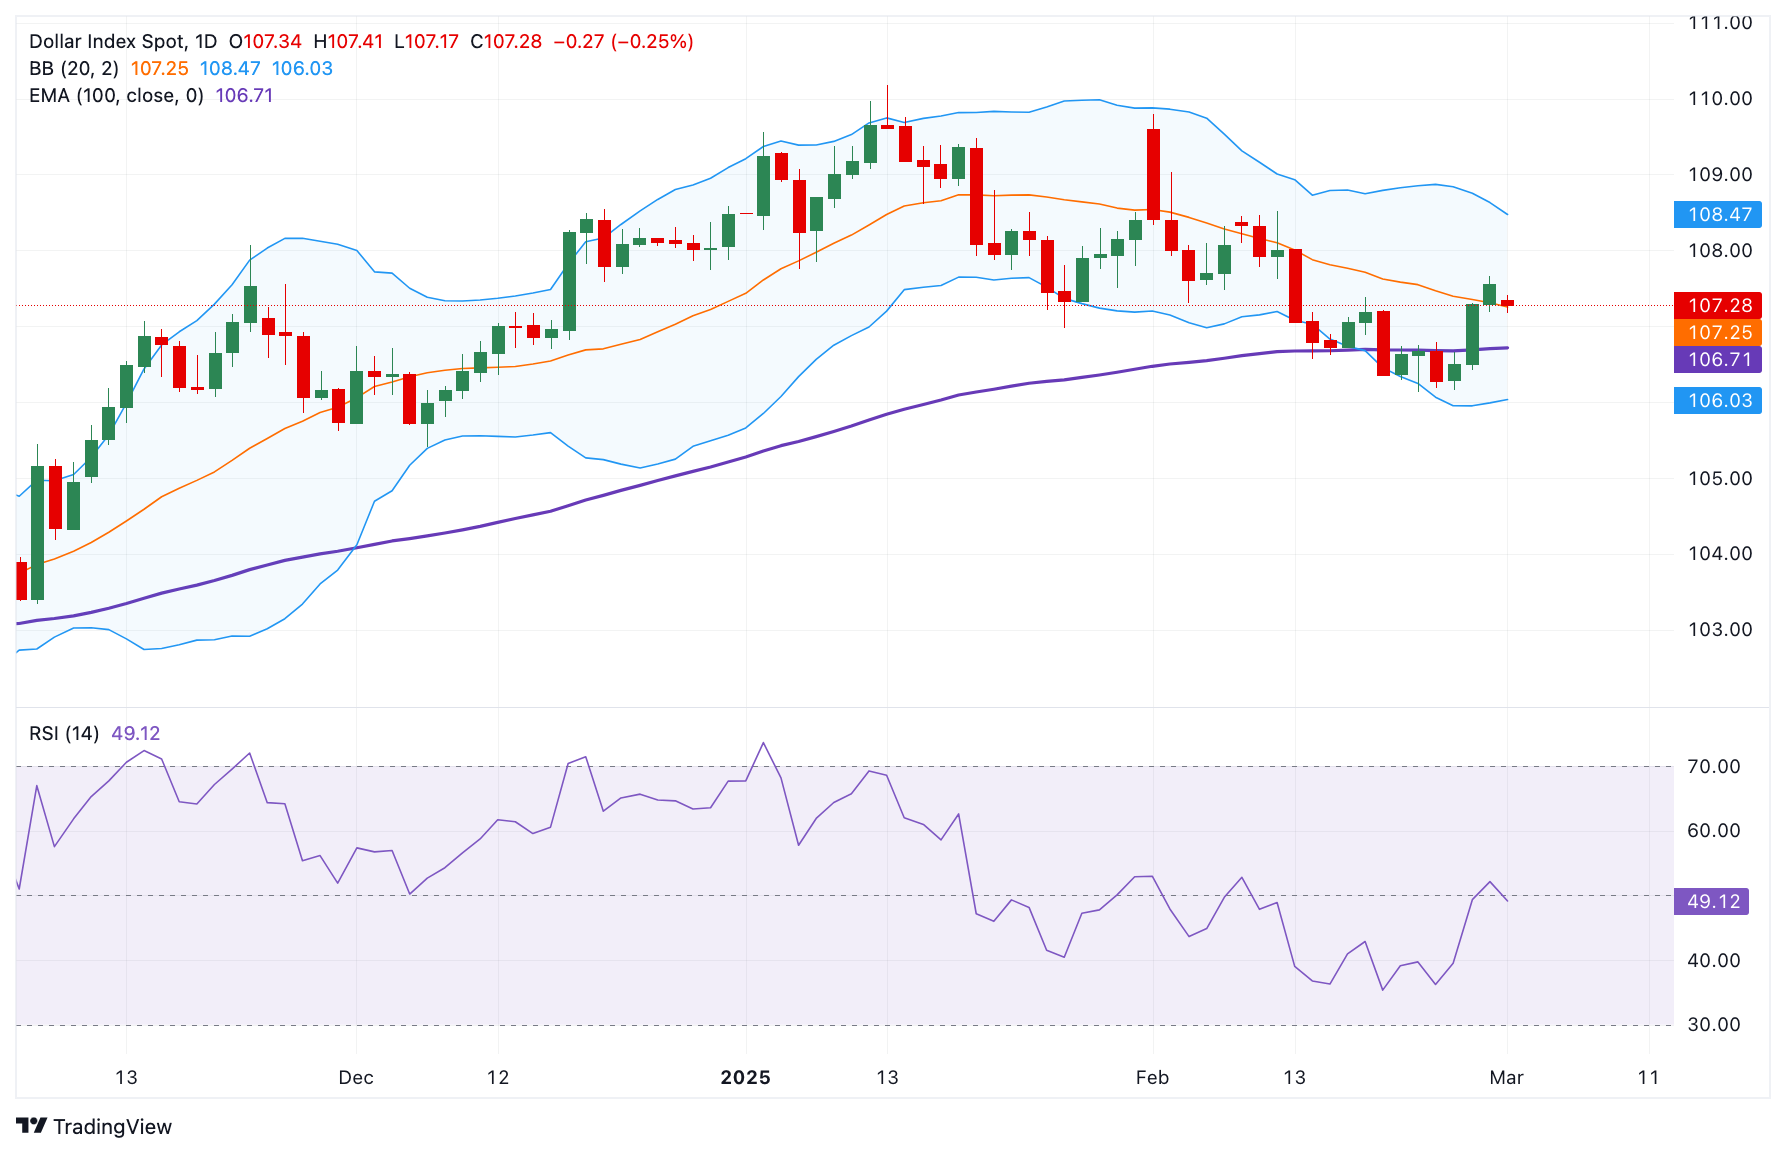
Technically, the bullish outlook of the DXY remains in play as the index holds above the key 100-day Exponential Moving Average (EMA) on the daily chart. Nonetheless, the 14-day Exponential Moving Average (EMA) hovers around the midline, suggesting that further consolidation cannot be ruled out in the near term.
On the bright side, the immediate resistance level for the US Dollar Index emerges near 108.45, representing the high of February 10 and the upper boundary of the Bollinger Band. Sustained trading above this level could pave the way to 109.80, the high of February 3. The additional upside filter to watch is the 110.00 psychological level.
On the flip side, the 100-day EMA at 106.70 acts as an initial support level for the DXY. A decisive break below the mentioned level could expose the key contention level at 106.00, portraying the round figure and the lower limit of the Bollinger Band. Further south, the next downside stop to watch is 105.41, the low of December 6, 2024.
The US Dollar Index (DXY) daily chart
US Dollar FAQs
The US Dollar (USD) is the official currency of the United States of America, and the ‘de facto’ currency of a significant number of other countries where it is found in circulation alongside local notes. It is the most heavily traded currency in the world, accounting for over 88% of all global foreign exchange turnover, or an average of $6.6 trillion in transactions per day, according to data from 2022. Following the second world war, the USD took over from the British Pound as the world’s reserve currency. For most of its history, the US Dollar was backed by Gold, until the Bretton Woods Agreement in 1971 when the Gold Standard went away.
The most important single factor impacting on the value of the US Dollar is monetary policy, which is shaped by the Federal Reserve (Fed). The Fed has two mandates: to achieve price stability (control inflation) and foster full employment. Its primary tool to achieve these two goals is by adjusting interest rates. When prices are rising too quickly and inflation is above the Fed’s 2% target, the Fed will raise rates, which helps the USD value. When inflation falls below 2% or the Unemployment Rate is too high, the Fed may lower interest rates, which weighs on the Greenback.
In extreme situations, the Federal Reserve can also print more Dollars and enact quantitative easing (QE). QE is the process by which the Fed substantially increases the flow of credit in a stuck financial system. It is a non-standard policy measure used when credit has dried up because banks will not lend to each other (out of the fear of counterparty default). It is a last resort when simply lowering interest rates is unlikely to achieve the necessary result. It was the Fed’s weapon of choice to combat the credit crunch that occurred during the Great Financial Crisis in 2008. It involves the Fed printing more Dollars and using them to buy US government bonds predominantly from financial institutions. QE usually leads to a weaker US Dollar.
Quantitative tightening (QT) is the reverse process whereby the Federal Reserve stops buying bonds from financial institutions and does not reinvest the principal from the bonds it holds maturing in new purchases. It is usually positive for the US Dollar.
Forex News
Keep up with the financial markets, know what's happening and what is affecting the markets with our latest market updates. Analyze market movers, trends and build your trading strategies accordingly.