Gold price approaches $2.690 barrier amid weaker USD, ahead of US CPI report
- Gold price reverses an intraday dip and turns positive for the second straight day on Wednesday.
- The USD drops to a fresh weekly low and is seen as a key factor that benefits the XAU/USD pair.
- The prospects for a slower Fed rate cut might cap the commodity ahead of the key US CPI report.
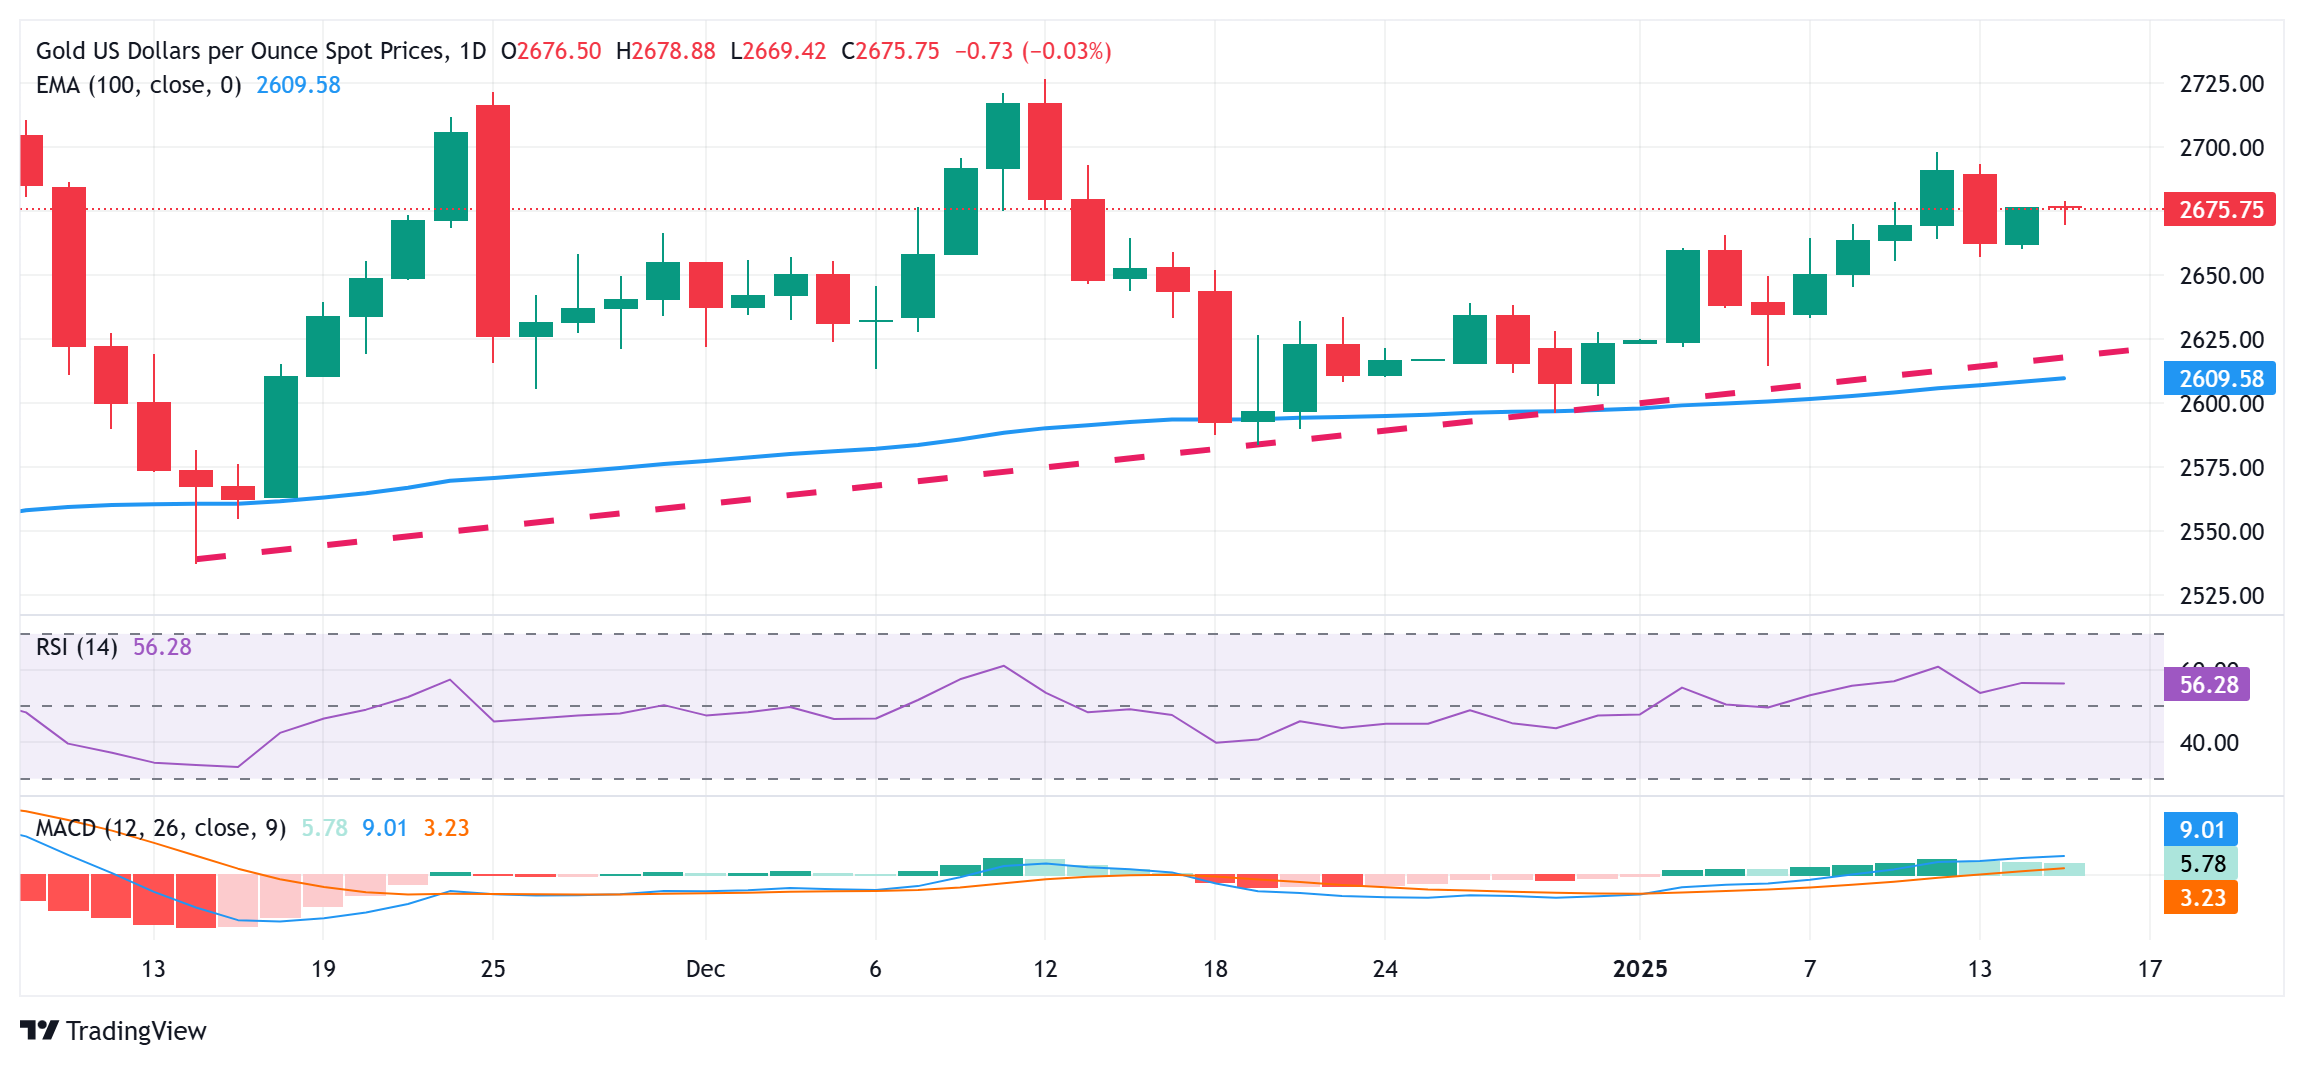
Gold price (XAU/USD) attracts some dip-buying near the $2,669 area on Wednesday and builds on its steady intraday ascent through the first half of the European session. The US Dollar (USD) prolongs its retracement slide from over a two-year high touched earlier this week in the wake of a softer US Producer Price Index (PPI) released on Tuesday. This turns out to be a key factor lending support to the commodity, though the risk-on mood, along with hawkish Federal Reserve's (Fed) expectations, might cap gains.
Easing fears about US President-elect Donald Trump's disruptive trade tariffs boosts investors' confidence, which is evident from a generally positive tone around the equity markets. Furthermore, the upbeat US jobs report reaffirmed expectations that the Fed will pause its rate-cutting cycle later this month. This keeps the US Treasury bond yields and might hold back traders from placing aggressive bullish bets around the non-yielding Gold price. Investors now look to the US consumer inflation figures for a fresh impetus.
Gold price draw support from retreating USD; focus remains glued to the US CPI report
- A Bloomberg report, citing people familiar with the matter, said on Monday that US President-elect Donald Trump's economic advisers are considering a program to gradually increase tariffs month by month.
- Moreover, softer-than-expected inflation data from the US helped pause the recent surge in the US Treasury bond yields, undermining the US Dollar and assisting the Gold price to attract buyers for the second straight day.
- The US Bureau of Labor Statistics reported on Tuesday that the Producer Price Index, which measures wholesale inflation, rose 0.2% in December and the core gauge remained flat during the reported month.
- This comes on the back of the upbeat US monthly jobs report on Friday and makes it difficult for investors to project the Federal Reserve's next moves on interest rates, which keeps the US Dollar bulls on the defensive.
- Ukraine launched its largest air attacks on Russia since the start of the war nearly three years ago. The Russian military said that the attacks would not go unanswered and launched more projectiles towards Ukraine.
- Israel launched fierce strikes on Gaza and intensified bombing on Tuesday, killing at least 13 people. Meanwhile, negotiators are nearing a breakthrough on the Gaza ceasefire after intense discussions in Qatar.
- Traders now look forward to the US Consumer Price Index (CPI) report for more insight into the Fed’s policy outlook, which will drive the USD demand and provide some meaningful impetus to the XAU/USD.
Gold price could accelerate the positive momentum once the $2,690 hurdle is cleared decisively

Technical indicators on the daily chart have been gaining positive traction and support prospects for the emergence of some dip-buyers near the $2,663-2,662 area. Some follow-through selling, however, could drag the Gold price to the next relevant support near the $2,336-$2,635 region. The downward trajectory could extend further towards the $2,615-2,614 confluence, comprising the 100-day Exponential Moving Average (SMA) and a multi-week-old ascending trend line. A convincing break below the latter would shift the near-term bias in favor of bearish traders and pave the way for deeper losses.
On the flip side, the $2,690 zone is likely to act as an immediate hurdle ahead of the $2,700 mark. Some follow-through buying will set the stage for an extension of over a three-week-old up-trend and lift the Gold price to the $2,716-2,717 hurdle en route to the December monthly swing high, around the $2,726 region.
Economic Indicator
Consumer Price Index (YoY)
Inflationary or deflationary tendencies are measured by periodically summing the prices of a basket of representative goods and services and presenting the data as The Consumer Price Index (CPI). CPI data is compiled on a monthly basis and released by the US Department of Labor Statistics. The YoY reading compares the prices of goods in the reference month to the same month a year earlier.The CPI is a key indicator to measure inflation and changes in purchasing trends. Generally speaking, a high reading is seen as bullish for the US Dollar (USD), while a low reading is seen as bearish.
Read more.Next release: Wed Jan 15, 2025 13:30
Frequency: Monthly
Consensus: 2.9%
Previous: 2.7%
Source: US Bureau of Labor Statistics
The US Federal Reserve has a dual mandate of maintaining price stability and maximum employment. According to such mandate, inflation should be at around 2% YoY and has become the weakest pillar of the central bank’s directive ever since the world suffered a pandemic, which extends to these days. Price pressures keep rising amid supply-chain issues and bottlenecks, with the Consumer Price Index (CPI) hanging at multi-decade highs. The Fed has already taken measures to tame inflation and is expected to maintain an aggressive stance in the foreseeable future.
Forex News
Keep up with the financial markets, know what's happening and what is affecting the markets with our latest market updates. Analyze market movers, trends and build your trading strategies accordingly.
