
Gold price retains intraday bullish bias amid softer USD, fading hopes for quick US-China trade deal
- Gold price regains positive traction as fading US-China trade optimism revives safe-haven demand.
- The US economic worries and Fed rate cut bets undermine the USD, and also benefit the commodity.
- A positive risk tone holds back the XAU/USD bulls from placing aggressive bets and caps the upside.
Gold price (XAU/USD) sticks to its positive bias through the early European session on Thursday and trades comfortably above the $3,300 mark. US Treasury Secretary Scott Bessent's remarks on Wednesday suggested that the current trade standoff between the US and China could continue for a while longer. Adding to this, heightened uncertainty over US President Donald Trump's tariffs and their impact on the global economy help revive demand for the safe-haven bullion following a two-day corrective slide from the all-time peak.
Apart from this, a modest US Dollar (USD) downtick and the prospects for more aggressive policy easing by the Federal Reserve (Fed) turn out to be another factor lending support to the non-yielding Gold price. Meanwhile, investors remain hopeful about a possible US-China trade deal. This, along with easing fears about the Fed's independence, remains supportive of a positive risk tone. This, in turn, is holding back traders from placing fresh bullish bets around the XAU/USD and capping any further appreciating move.
Daily Digest Market Movers: Gold price continues to draw support from reviving safe-haven demand
- US Treasury Secretary Scott Bessent denied reports that the White House is considering unilaterally slashing tariffs on Chinese imports. Bessent added that high duties imposed by both sides need to come down mutually before talks can begin, tempering hopes for a quick resolution to the US-China trade standoff and reviving demand for the traditional safe-haven Gold price.
- The Federal Reserve's Beige Book showed that pervasive uncertainty over US President Donald Trump’s shifting tariff plans threatens to curtail growth in the months ahead. The report further revealed that consumer spending remains mixed, while the labor market has shown signs of cooling after stalling or edging lower in many Fed districts, pointing to a gloomy outlook.
- On the economic data front, a preliminary reading of S&P Global’s Composite PMI indicated US business activity expanded at a slower pace in April. The data revealed a diverging performance across sectors, with manufacturing activity continuing to grow modestly, while the non-manufacturing PMI pointed to signs that demand in the services sector may be losing steam.
- The US Dollar erodes a part of its recovery gains registered over the past two days amid bets that the Federal Reserve will resume its rate-cutting cycle in June and lower borrowing costs at least three times by the end of this year. This turns out to be another factor that benefits the non-yielding yellow metal, though a generally positive risk tone might cap any further gains.
- Meanwhile, signs of easing trade tensions between the world's two largest economies and receding fears that the Fed could lose its autonomy boosted investors' appetite for riskier assets. This might hold back bulls from placing fresh bets around the XAU/USD as traders now look to the US macro data – Jobless Claims and Durable Goods Orders – for short-term impetuses.
Gold price needs to surpass the 23.6% Fibo. level support breakpoint for bulls to regain short-term control
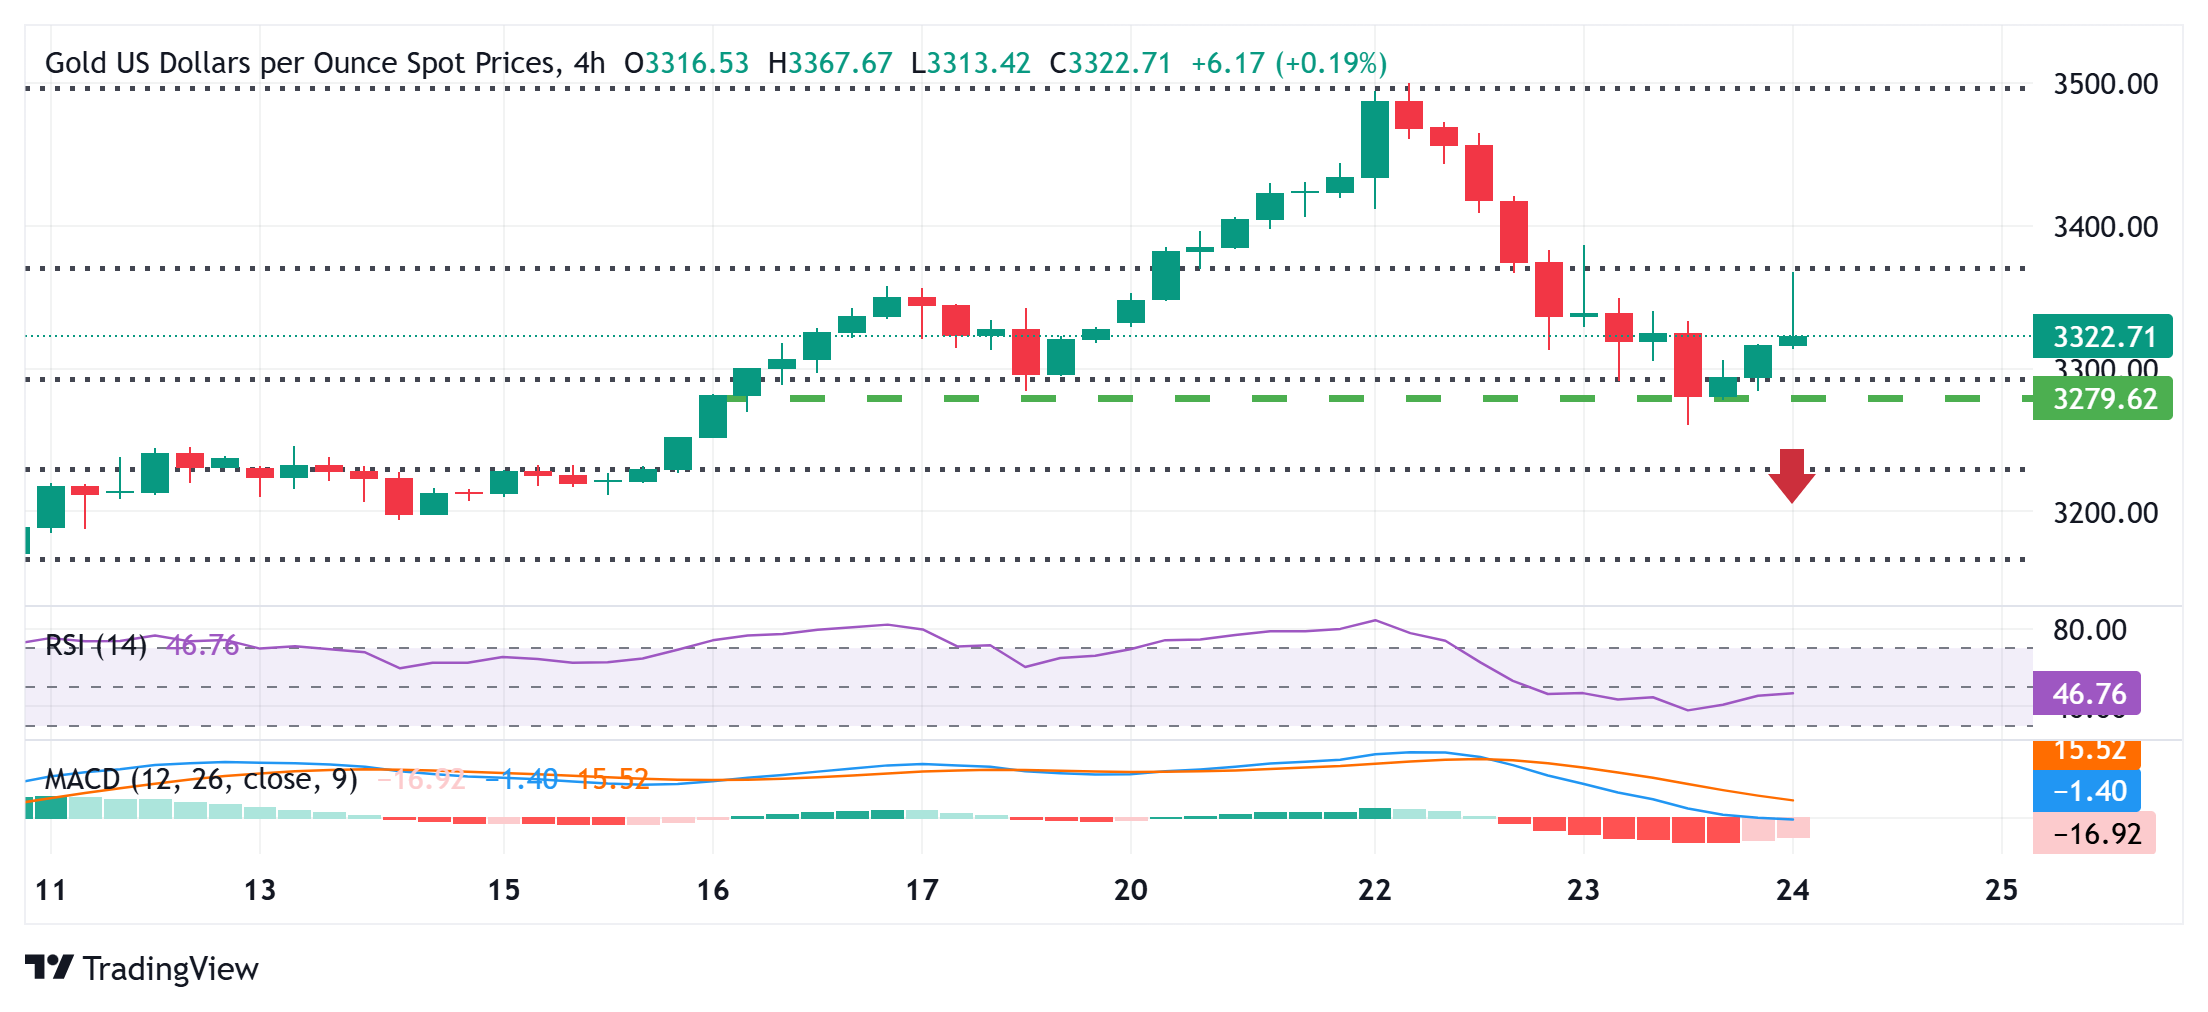
From a technical perspective, the precious metal showed some resilience below the 38.2% Fibonacci retracement level of the latest leg up from the vicinity of mid-$2,900s or the monthly swing low. The subsequent move up, however, falters near the 23.6% Fibo. level, around the $3,367-3,368 region, which should now act as a key pivotal point. Given that oscillators on the daily chart are still holding comfortably in positive territory, some follow-through buying should allow the Gold price to reclaim the $3,400 mark. The momentum could extend further towards the $3,425-3,427 intermediate hurdle, above which bulls could make a fresh attempt to conquer the $3,500 psychological mark.
On the flip side, the $3,300 mark, followed by the $3,288 zone (38.2% Fibo. level) and the overnight swing low, around the $3,260 area, could offer support to the XAU/USD. A convincing break below the latter could drag the Gold price further toward the 50% retracement level, around the $3,225 region. Some follow-through selling, leading to a subsequent slide below the $3,200 mark, will suggest that the precious metal has topped out in the near term and pave the way for an extension of this week's retracement slide from the all-time peak.
US Dollar PRICE Today
The table below shows the percentage change of US Dollar (USD) against listed major currencies today. US Dollar was the strongest against the Canadian Dollar.
| USD | EUR | GBP | JPY | CAD | AUD | NZD | CHF | |
|---|---|---|---|---|---|---|---|---|
| USD | -0.56% | -0.30% | -0.58% | -0.28% | -0.38% | -0.45% | -0.47% | |
| EUR | 0.56% | 0.27% | -0.03% | 0.28% | 0.15% | 0.11% | 0.09% | |
| GBP | 0.30% | -0.27% | -0.27% | 0.01% | -0.11% | -0.16% | -0.18% | |
| JPY | 0.58% | 0.03% | 0.27% | 0.30% | 0.20% | 0.09% | 0.15% | |
| CAD | 0.28% | -0.28% | -0.01% | -0.30% | -0.07% | -0.15% | -0.19% | |
| AUD | 0.38% | -0.15% | 0.11% | -0.20% | 0.07% | -0.05% | -0.09% | |
| NZD | 0.45% | -0.11% | 0.16% | -0.09% | 0.15% | 0.05% | -0.02% | |
| CHF | 0.47% | -0.09% | 0.18% | -0.15% | 0.19% | 0.09% | 0.02% |
The heat map shows percentage changes of major currencies against each other. The base currency is picked from the left column, while the quote currency is picked from the top row. For example, if you pick the US Dollar from the left column and move along the horizontal line to the Japanese Yen, the percentage change displayed in the box will represent USD (base)/JPY (quote).
Forex News
Keep up with the financial markets, know what's happening and what is affecting the markets with our latest market updates. Analyze market movers, trends and build your trading strategies accordingly.