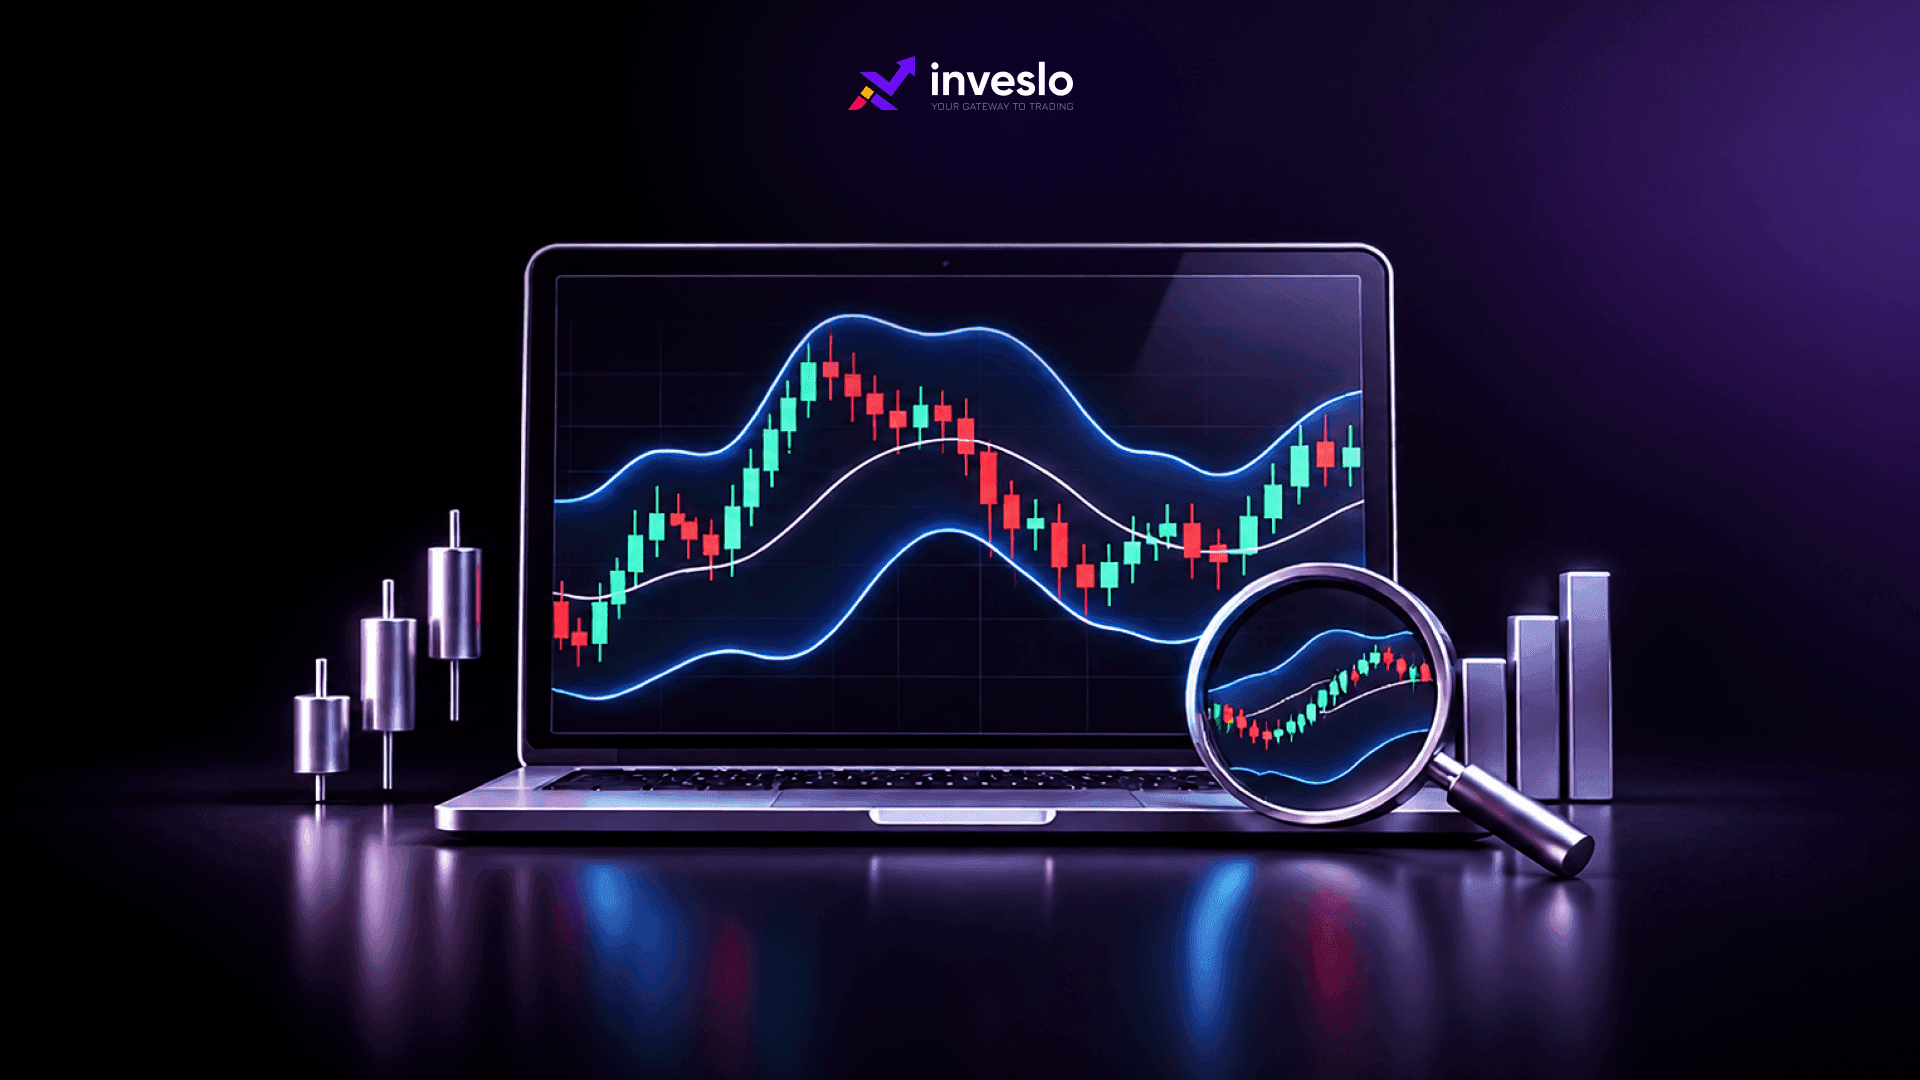
A currency pair moves sideways for several hours, and Bollinger Bands begin to contract before the price suddenly breaks out of its usual trading range. For traders, the challenge is deciding whether that movement signals a developing trend or another short-lived price fluctuation.
Entering too early can expose a position to unnecessary risk. Waiting too long may mean missing much of the movement.
Bollinger Bands help traders assess these conditions by showing how far prices move from their recent average and whether market volatility is increasing or decreasing.
The indicator can highlight potential breakouts, price reversals, and changes in market activity. However, understanding the position and width of the bands matters more than reacting to every price movement near them.
What are Bollinger Bands in Trading?
Bollinger Bands are a technical analysis indicator developed by John Bollinger in the 1980s to measure market volatility and identify relative price levels.
The indicator consists of three lines plotted around market prices:
Middle Band: A simple moving average (SMA), commonly calculated over 20 periods.
Upper Band: The moving average plus a specified number of standard deviations, typically two.
Lower Band: The moving average minus the same number of standard deviations.
Standard deviation measures how widely prices vary around their average. As price fluctuations increase, the distance between the outer bands generally grows. When market movements become smaller, the bands move closer together.
Unlike fixed price channels, Bollinger Bands adjust their width as recent market conditions change.
They help traders assess whether prices are relatively high or low compared with their recent trading range. That information alone does not establish whether an asset is overvalued, undervalued, or likely to reverse.
How Does the Bollinger Bands Indicator Work?
The Bollinger Bands indicator calculates its upper and lower boundaries using recent closing prices. The commonly used settings are 20 periods for the moving average and two standard deviations for the outer bands.
The calculations follow these formulas:
Middle Band = 20-Period Simple Moving Average
Upper Band = Middle Band + (2 × Standard Deviation)
Lower Band = Middle Band − (2 × Standard Deviation)
Consider a hypothetical EUR/USD chart. Suppose the 20-period moving average is 1.1000 and the standard deviation of closing prices is 0.0020.
The indicator would calculate:
Band | Price Level |
Upper Band | 1.1040 |
Middle Band | 1.1000 |
Lower Band | 1.0960 |
If market volatility increases, the standard deviation may rise, causing the bands to widen. If prices begin moving within a smaller range, the bands may narrow. These calculations respond to historical prices. Bollinger Bands do not predict future price movements or guarantee that prices will remain within their boundaries.
How to Read Bollinger Bands for Market Volatility
The position of the price relative to the bands provides useful information, but traders should also consider the direction of the broader market.
1. Narrow Bands Indicate Lower Volatility
When the upper and lower bands move closer together, recent price fluctuations have become smaller. This often happens during consolidation, when prices trade within a limited range.
Narrow bands can signal that the market is experiencing relatively low volatility. However, they cannot determine when the next major movement will begin.
2. Wide Bands Indicate Higher Volatility
When the bands move further apart, recent price movements have become larger. This can happen during strong trends, major economic announcements, or periods of uncertainty.
Wider bands indicate increased volatility, but they do not automatically mean that the current trend is ending.
3. Price Movement Near the Outer Bands
A price approaching the upper band is relatively high compared with its recent average. Similarly, a price near the lower band is relatively low. Traders sometimes interpret these conditions as potential reversal opportunities.
However, strong trends can keep prices near an outer band for extended periods. A band touch should therefore be treated as market information rather than an automatic instruction to buy or sell.
Bollinger Bands Trading Strategies for Different Market Conditions
The usefulness of a Bollinger Bands strategy depends on whether the market is ranging, trending, or experiencing a change in volatility.
1. Bollinger Bands Squeeze Strategy
A Bollinger Bands squeeze occurs when the upper and lower bands move unusually close together. This indicates that recent market volatility has declined.
Traders monitor these conditions because periods of low volatility can sometimes precede stronger price movements.
A practical approach involves:
Identifying a period when the bands have narrowed compared with their recent width.
Marking nearby support and resistance levels.
Watching for a price close beyond the trading range.
Checking whether the bands begin expanding as the breakout develops.
Assessing the risk before entering a position.
For example, if EUR/USD trades within a narrow range and subsequently closes above resistance while the bands widen, traders may interpret the movement as a potential bullish breakout.
However, a squeeze does not identify the direction of the next move. Some breakouts reverse quickly, so confirmation through price action and risk controls remains important.
2. Bollinger Bands Mean Reversion Strategy
Mean reversion refers to the possibility that prices may move back toward their recent average after trading unusually far from it. Traders commonly consider this approach during sideways market conditions.
For example, if a currency pair reaches the lower band while trading near an established support level, traders may watch for signs that selling pressure is weakening.
A potential buying setup might involve a rejection of lower prices followed by movement back toward the middle band.
The opposite situation may occur near the upper band. Mean reversion strategies can struggle during strong trends because prices may continue moving in one direction rather than returning toward the average.
3. Bollinger Bands Trend Continuation Strategy
During a strong uptrend, prices may repeatedly approach or remain close to the upper band. In a downtrend, prices may stay near the lower band. This behaviour is sometimes called walking the bands.
Instead of expecting an immediate reversal, traders may assess whether the existing trend remains intact. For example, during an uptrend, a pullback toward the middle band followed by renewed buying activity may suggest that the trend is continuing.
The middle band can act as a reference point, although it is not guaranteed to provide support or resistance. Traders should assess the broader trend before interpreting price movements near either outer band.
How to Identify Trading Signals Using Bollinger Bands
A Bollinger Bands trading signal becomes more meaningful when several market conditions support the same interpretation.
The following table explains how traders may approach different situations.
Market Condition | Possible Interpretation | What to Check |
Bands narrowing | Volatility is declining | Support and resistance |
Bands widening | Volatility is increasing | Direction and strength of price movement |
Price near upper band | Price is relatively high | Trend direction and momentum |
Price near lower band | Price is relatively low | Support and signs of recovery |
Price closing outside a band | Possible breakout or strong momentum | Follow-through and reversal risk |
Price returning inside bands | Possible failed breakout | Subsequent candle behaviour |
No individual condition guarantees a profitable trade.
For instance, a close above the upper band can indicate strong buying activity rather than an immediate selling opportunity. Traders should decide whether the market is more likely to be trending or ranging before selecting a strategy.
How to Use Bollinger Bands With Other Technical Indicators
Bollinger Bands measure relative price levels and volatility. They do not directly measure every aspect of market strength. Combining them with tools that provide different information can improve the quality of market analysis.
1. Relative Strength Index (RSI)
RSI measures the speed and size of recent price movements. Traders may use RSI to assess whether momentum supports a potential reversal or trend continuation identified through Bollinger Bands.
For example, a price movement near the lower band accompanied by improving momentum may justify further analysis of a possible recovery. Neither indicator confirms the outcome on its own.
2. Support and Resistance
Support and resistance levels can help traders assess whether a band touch occurs near an important price area. A lower-band touch near established support may carry a different interpretation from one occurring during a strong downtrend.
3. Price Action
Candlestick patterns and recent market structure can provide additional price action context. Rather than relying solely on the indicator, traders can review whether prices are forming higher highs, lower lows, or repeated rejection patterns. The aim is to develop a consistent decision process rather than collect as many indicators as possible.
How to Manage Risk When Trading With Bollinger Bands
Volatility analysis becomes more useful when traders connect it to position sizing and exit decisions. A wide trading range may require a larger stop-loss distance. However, increasing that distance without reducing position size can increase the amount at risk.
Traders should consider the following:
Define an exit before entering: Identify the price level that would invalidate the original trading idea.
Adjust position size: Calculate how much of the account could be lost if the trade reaches its stop-loss.
Account for changing spreads: Spreads may widen during uncertain market conditions, increasing trading costs or affecting order execution.
Avoid treating every breakout as confirmation: Price can temporarily move outside a band before reversing.
Review economic announcements: Major releases may cause sudden movements that are difficult to assess using recent volatility alone.
A stop-loss can help limit planned losses, but it cannot guarantee execution at the requested price.
Common Mistakes When Using Bollinger Bands
Several interpretation errors can weaken an otherwise reasonable trading approach.
Treating every upper-band touch as a sell signal: During an uptrend, prices can remain close to the upper band for multiple candles.
Buying every lower-band touch: A falling market may continue declining despite appearing relatively low.
Assuming a squeeze guarantees a breakout: Narrow bands indicate lower volatility, not the timing or direction of the next movement.
Using identical settings for every trading style: Different instruments and timeframes may require different approaches.
Ignoring trading costs: Frequent trades during smaller price movements may become less attractive after spreads and other applicable charges.
Traders should test their chosen settings against the instrument, timeframe, and trading conditions rather than assuming that one configuration will work everywhere.
Conclusion
Bollinger Bands can help traders understand whether recent market activity is becoming quieter or more volatile. Their value comes from interpreting these changes alongside price behaviour rather than treating the outer bands as fixed buying and selling levels.
A trader examining a squeeze should assess potential breakout conditions. Someone considering a reversal should first determine whether the market is ranging or trending. Each decision should account for the possibility that the expected price movement will not occur.
Traders can use an Inveslo demo trading account to practise chart analysis and assess how different market conditions affect their trading decisions before committing real funds.
Frequently Asked Questions About Bollinger Bands
Q1. What are the Best Bollinger Bands Settings?
A. The commonly used settings are a 20-period moving average with bands positioned two standard deviations above and below it. These provide a starting point, but traders may test other settings depending on their strategy.
Q2. Can Bollinger Bands Predict Market Direction?
A. No. Bollinger Bands respond to historical price movements. They can identify changes in volatility and relative price levels but cannot reliably predict future direction.
Q3. Are Bollinger Bands Suitable for Forex Trading?
A. Yes. Traders can apply the indicator to forex charts across different timeframes. Its interpretation should account for changing market conditions and the behaviour of the selected currency pair.
Q4. What is the Bollinger Bands Squeeze?
A. A squeeze occurs when the distance between the outer bands becomes unusually narrow. It indicates reduced recent volatility and may precede stronger price activity, although the timing and direction remain uncertain.
Q5. Can Beginners Use Bollinger Bands?
A. Yes. Beginners can use Bollinger Bands to understand volatility and relative price levels. Practicing with historical charts or a demo account can help them assess signals before risking real capital.
Related articles
 ForexInveslo
What is a Stop-Loss Order? How it Helps Manage Potential Losses
You enter a trade expecting the market to move in your favour, but the price suddenly moves in the opposite direction. Do you close the position immediately, wait for a recovery, or accept a larger loss?
 ForexInveslo
Manual Trading vs Automated Trading: Which is Better?
A trader can have a solid strategy and still struggle with one basic decision: should every trade be placed manually, or should software handle the process? Manual trading gives you direct control over analysis, entries, exits, and trade management. Automated trading uses predefined rules to monitor
 ForexInveslo
Day Trading vs Swing Trading: Key Differences and How to Choose
Choosing between day trading and swing trading is less about finding the “better” strategy and more about finding the one you can execute consistently. Day trading keeps positions inside the same trading day and usually demands more screen time, faster decisions, and closer attention to short-term