
Japanese Yen retains bullish bias; sits near multi-month high against weaker USD
- The Japanese Yen continues to attract safe-haven flows amid the escalating US-China trade war.
- Hopes that Japan might strike a trade deal with the US contribute to the bid tone around the JPY.
- The divergent BoJ-Fed policy expectations provide an additional boost to the lower-yielding JPY.
The Japanese Yen (JPY) stands firm near the highest level since late September 2024 touched against a broadly weaker US Dollar (USD) last Friday as worries about the escalating US-China trade war continue to underpin traditional safe-haven assets. Apart from this, the optimism over a possible US-Japan trade deal, along with bets that the Bank of Japan (BoJ) will continue raising interest rates in 2025 amid signs of broadening inflation in Japan, lend additional support to the JPY.
Meanwhile, hawkish BoJ expectations mark a big divergence in comparison to the prospects for more aggressive policy easing by the Federal Reserve (Fed), bolstered by concerns about a tariffs-driven US economic slowdown. This keeps the USD depressed near its lowest level since April 2022 and suggests that the path of least resistance for the lower-yielding JPY is to the upside, which, in turn, supports prospects for an extension of the USD/JPY pair's multi-month-old downtrend.
Japanese Yen remains well supported by US-China trade war-inspired flight to safety
- China's announced on Friday that it has raised tariffs on US goods to 125%, while US President Donald Trump hiked duties on Chinese imports to an unprecedented 145%. This fuel worries about the potential economic fallout from the escalating trade war between the world's two largest economies and drive some safe-haven flows toward the Japanese Yen.
- Investors remain optimistic about a positive outcome from US-Japan trade talks. In fact, Trump said last week that tough but fair parameters are being set for a negotiation. Adding to this, US Treasury Secretary Scott Bessent said that Japan may be a priority in tariff negotiations, fueling hopes for a possible US-Japan trade deal and further underpinning the JPY.
- Japanese Prime Minister (PM) Shigeru Ishiba warned on Monday that “US tariffs have the potential to disrupt the world economic order.” Separately, Japan’s Finance Minister Shunichi Kato said that “the US and Japan share the view that excessive FX volatility is undesirable.” Moreover, Japan's Economy Minister Ryosei Akazawa stated that "the FX issues will be dealt with between Finance Minister Kato and US Treasury Secretary Scott Bessent."
- Meanwhile, the Bank of Japan's preliminary report released last Thursday showed that annual wholesale inflation accelerated to 4.2% in March. This is a sign of persistent cost pressures, which, along with strong wage growth, should contribute to mounting domestic inflationary pressure and allow the BoJ to continue raising interest rates this year.
- In contrast, the latest reading of the US Consumer Price Index indicated that inflation slowed sharply in March. This comes on top of the weakening confidence in the US economy and should allow the Federal Reserve to resume its rate-cutting cycle. Moreover, market participants are now pricing in the possibility of 90 basis points of rate cuts by the end of this year.
- The divergent BoJ-Fed policy expectations turn out to be another factor that benefits the lower-yielding JPY. The US Dollar, on the other hand, languishes near its lowest level since April 2022 touched on Friday. This, in turn, drags the USD/JPY pair back closer to a multi-month low during the Asian session on Monday and supports prospects for further losses.
USD/JPY could accelerate the downward trajectory once the 142.00 handle is broken
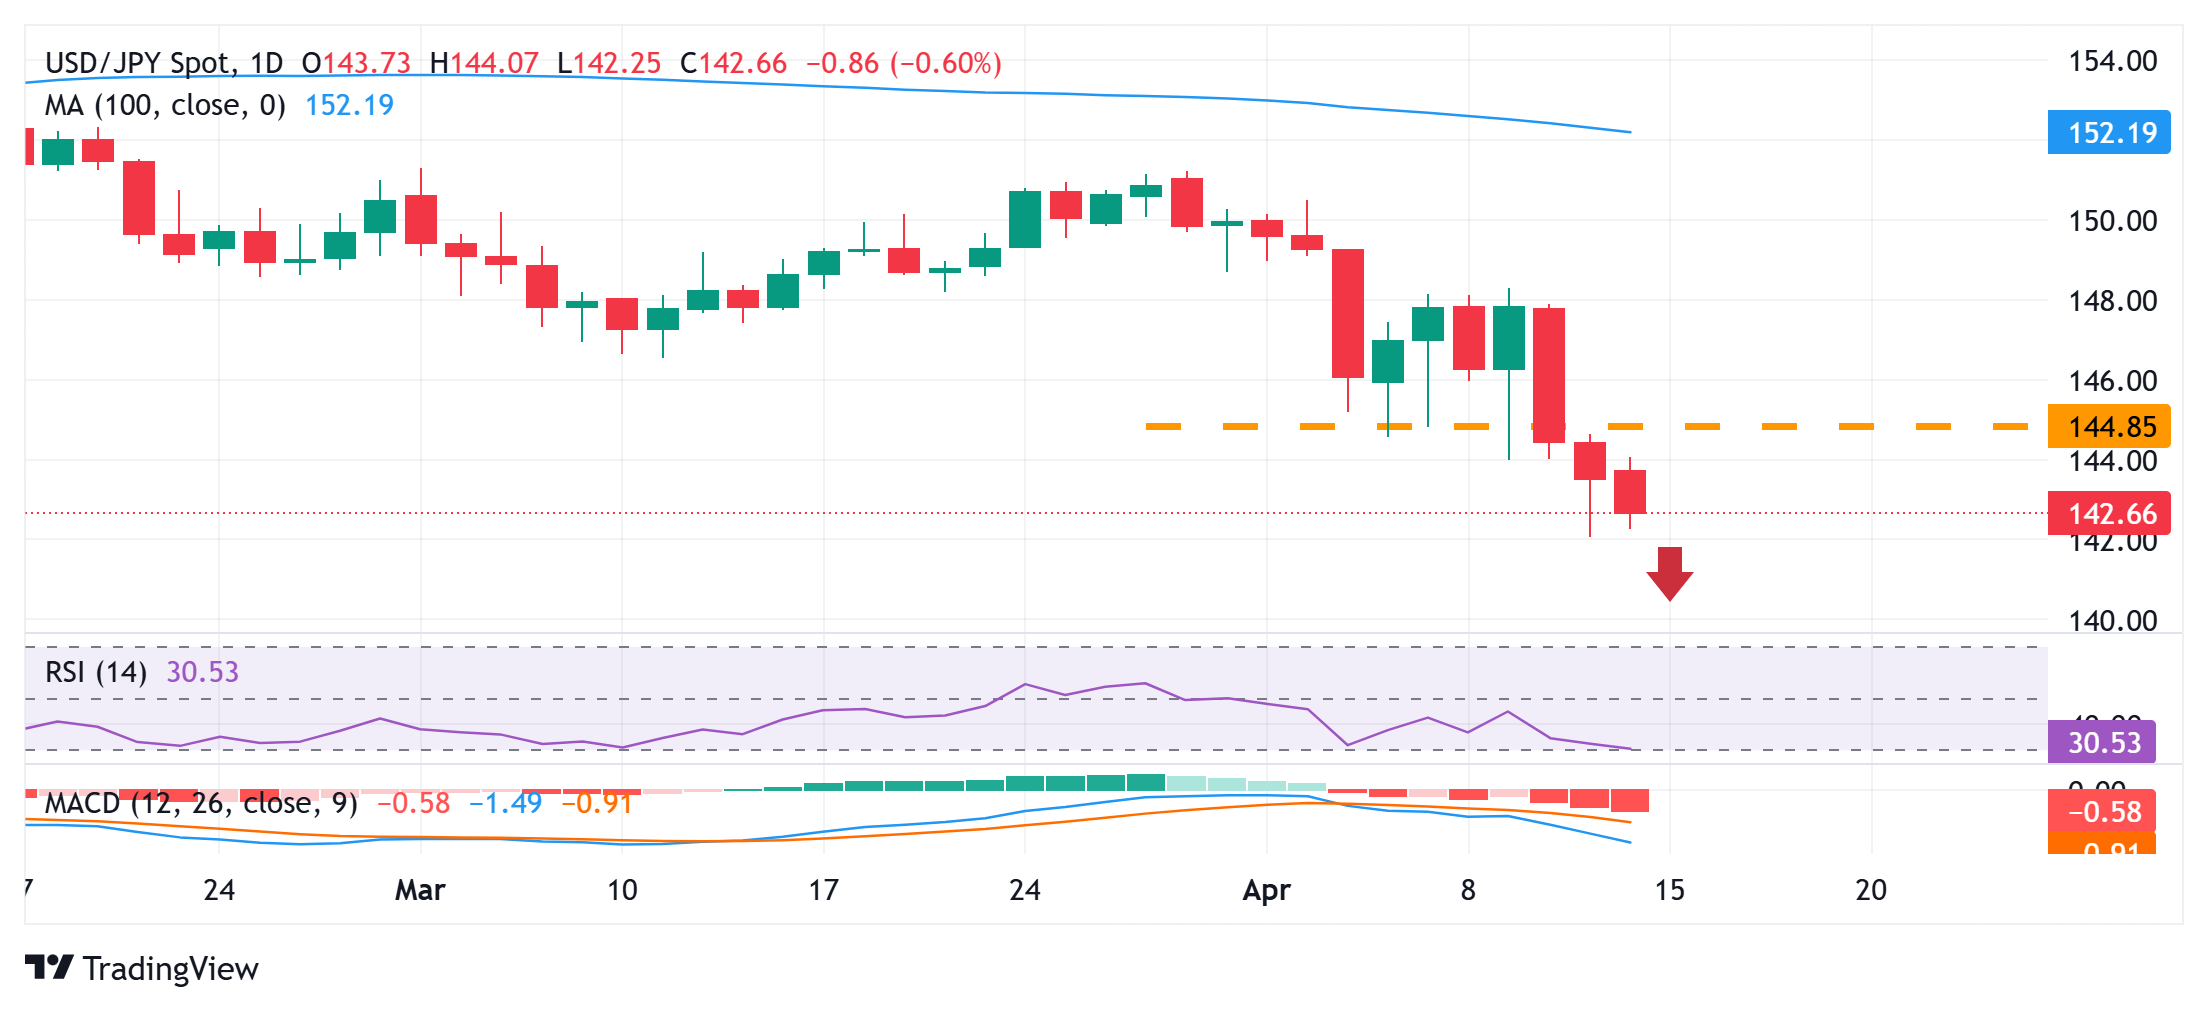
From a technical perspective, the daily Relative Strength Index (RSI) is on the verge of breaking into the oversold territory and warrants some caution for bearish traders. Hence, it will be prudent to wait for some near-term consolidation or a modest bounce before positioning for an extension of over a three-month-old downtrend. In the meantime, the 142.00 mark, or a multi-month low touched on Friday, could offer some support to the USD/JPY pair. A convincing break below could drag spot prices towards the 141.65-141.60 intermediate support en route to the 141.00 mark. Some follow-through selling below the 140.75 zone might expose the September 2024 swing low, around the 140.30-140.25 region, before the pair eventually drops to the 140.00 psychological mark.
On the flip side, any attempted recovery back above the 143.00 mark is likely to confront stiff resistance near the 143.50-143.55 zone. The subsequent move up could lift the USD/JPY pair to the Asian session peak, around the 144.00 round figure, which if cleared decisively might trigger a short-covering rally to the 144.45-144.50 horizontal resistance. The momentum could extend further towards reclaiming the 145.00 psychological mark en route to the 145.50 zone and the 146.00 round figure.
US Dollar PRICE Today
The table below shows the percentage change of US Dollar (USD) against listed major currencies today. US Dollar was the strongest against the Canadian Dollar.
| USD | EUR | GBP | JPY | CAD | AUD | NZD | CHF | |
|---|---|---|---|---|---|---|---|---|
| USD | -0.33% | -0.60% | -1.07% | -0.17% | -0.65% | -1.02% | -0.58% | |
| EUR | 0.33% | 0.21% | -0.31% | 0.61% | 0.42% | -0.26% | 0.18% | |
| GBP | 0.60% | -0.21% | -0.11% | 0.38% | 0.20% | -0.48% | -0.03% | |
| JPY | 1.07% | 0.31% | 0.11% | 0.87% | 0.16% | -0.18% | 0.64% | |
| CAD | 0.17% | -0.61% | -0.38% | -0.87% | -0.44% | -0.85% | -0.48% | |
| AUD | 0.65% | -0.42% | -0.20% | -0.16% | 0.44% | -0.67% | -0.23% | |
| NZD | 1.02% | 0.26% | 0.48% | 0.18% | 0.85% | 0.67% | 0.47% | |
| CHF | 0.58% | -0.18% | 0.03% | -0.64% | 0.48% | 0.23% | -0.47% |
The heat map shows percentage changes of major currencies against each other. The base currency is picked from the left column, while the quote currency is picked from the top row. For example, if you pick the US Dollar from the left column and move along the horizontal line to the Japanese Yen, the percentage change displayed in the box will represent USD (base)/JPY (quote).
Forex News
Keep up with the financial markets, know what's happening and what is affecting the markets with our latest market updates. Analyze market movers, trends and build your trading strategies accordingly.