Japanese Yen breaks four-day winning streak as US Dollar Index retreats from yearly highs
- The Japanese Yen appreciates as the US Dollar corrects downwards ahead of Retail Sales data.
- Japan’s GDP annualized growth for Q3 was 0.9%, slowing down from the 2.2% growth recorded in Q2.
- Japan’s Kato stated that he would take appropriate action to address excessive fluctuations in foreign exchange rates.
The Japanese Yen (JPY) gains ground against the US Dollar (USD), breaking its four-day winning streak on Friday. However, the JPY faced challenges following the release of Japan’s Q3 Gross Domestic Product (GDP) data on Friday. The upside potential of the USD/JPY pair was supported by the strength of the US Dollar (USD). Traders are also preparing for the release of the US October Retail Sales data, due later on Friday.
Japan's preliminary Gross Domestic Product (GDP) grew by 0.2% quarter-on-quarter in the third quarter, down from 0.5% in the previous quarter, matching market expectations. The country's annualized GDP growth for Q3 was 0.9%, surpassing the market consensus of 0.7%, but showing a sharp slowdown from the 2.2% growth recorded in Q2.
Japan’s Finance Minister, Katsunobu Kato, stated on Friday that he will take appropriate action against excessive fluctuations in foreign exchange (FX) rates. Kato emphasized the importance of stable FX movements that reflect economic fundamentals and expressed concern over one-sided, sharp shifts in the market.
Meanwhile, Japan's Economy Minister, Ryosei Akazawa, said that he expects a modest economic recovery to continue, fueled by improvements in employment and wages. However, Akazawa also emphasized the need to carefully monitor potential downside risks from global economies and volatility in financial and capital markets.
Japanese Yen remains under pressure amid a slowdown in domestic economic activities
- The US Dollar Index (DXY), which tracks the US Dollar's performance against six major currencies, trades around 106.70. after pulling back from its yearly high of 107.06 recorded on Thursday. This decline could be attributed to a slowdown in "Trump trades."
- On Thursday, Fed Chair Jerome Powell noted that the recent performance of the US economy has been "remarkably good," allowing the Fed room to gradually lower interest rates. Meanwhile, Richmond Fed President Thomas Barkin stated that while the Fed has made strong progress so far, there’s still more work to be done to keep the momentum going.
- The US Producer Price Index (PPI) rose by 2.4% year-over-year in October, up from a revised 1.9% increase in September (previously 1.8%) and surpassing market expectations of 2.3%. Meanwhile, the Core PPI, which excludes food and energy, climbed 3.1% YoY, slightly above the anticipated 3.0%.
- BoJ Deputy Governor Shinichi Uchida highlighted on Thursday the need for financial institutions and authorities to be prepared for sudden deposit outflows due to digitalization and technological advances. Uchida also noted the relationship between non-bank financial institutions and the banking sector has strengthened, any deterioration in the non-bank sector could ripple through the entire financial system via market channels.
- Japan’s Producer Price Index (PPI) increased by 3.4% year-over-year in October, exceeding the expected 3.0% and previous 3.1% readings. Meanwhile, the PPI rose by 0.2% month-over-month, surpassing the expected flat growth for the month.
- BoJ’s Summary of Opinions from its October meeting highlighted division among policymakers regarding additional rate hikes. Nevertheless, the central bank maintained its outlook, suggesting it could raise its benchmark rate to 1% by the second half of fiscal 2025, amounting to a total policy tightening of 75 basis points from the current rate.
- US Consumer Price Index (CPI) rose by 2.6% year-over-year in October, as expected. Meanwhile, the core CPI, which excludes the more volatile food and energy components, rose by 3.3% in line with market forecasts.
Technical Analysis: USD/JPY rises to near 156.50 as bullish bias prevails
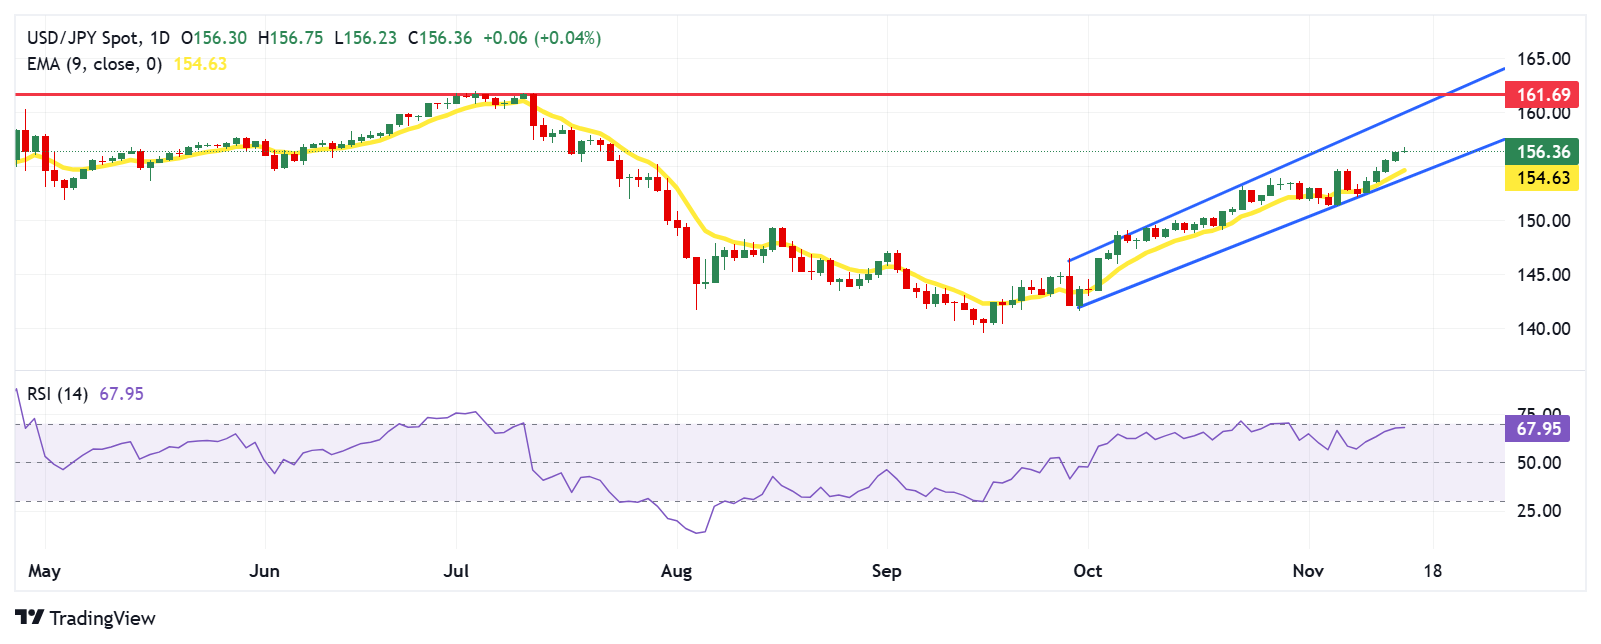
USD/JPY trades around 156.50 on Friday. Daily chart analysis shows a continued bullish bias, with the pair moving upwards within an ascending channel pattern. The 14-day Relative Strength Index (RSI) is just below the 70 level, supporting the bullish outlook. A breakout above the 70 mark would indicate an overbought condition, potentially leading to a downward correction for the pair.
The USD/JPY pair could target the upper boundary of the ascending channel near the 159.70 level. A breakout above this level would reinforce the bullish sentiment and potentially push the pair toward its four-month high of 161.69, recorded on July 11.
On the downside, the USD/JPY pair could find support at the nine-day Exponential Moving Average (EMA) around 154.65, followed by the lower boundary of the ascending channel at 153.90.
USD/JPY: Daily Chart
Japanese Yen PRICE Today
The table below shows the percentage change of Japanese Yen (JPY) against listed major currencies today. Japanese Yen was the strongest against the US Dollar.
| USD | EUR | GBP | JPY | CAD | AUD | NZD | CHF | |
|---|---|---|---|---|---|---|---|---|
| USD | -0.32% | -0.20% | -0.09% | -0.05% | -0.26% | -0.30% | -0.31% | |
| EUR | 0.32% | 0.12% | 0.21% | 0.28% | 0.07% | 0.01% | 0.02% | |
| GBP | 0.20% | -0.12% | 0.08% | 0.16% | -0.06% | -0.11% | -0.11% | |
| JPY | 0.09% | -0.21% | -0.08% | 0.07% | -0.16% | -0.22% | -0.21% | |
| CAD | 0.05% | -0.28% | -0.16% | -0.07% | -0.23% | -0.26% | -0.28% | |
| AUD | 0.26% | -0.07% | 0.06% | 0.16% | 0.23% | -0.05% | -0.06% | |
| NZD | 0.30% | -0.01% | 0.11% | 0.22% | 0.26% | 0.05% | -0.00% | |
| CHF | 0.31% | -0.02% | 0.11% | 0.21% | 0.28% | 0.06% | 0.00% |
The heat map shows percentage changes of major currencies against each other. The base currency is picked from the left column, while the quote currency is picked from the top row. For example, if you pick the Japanese Yen from the left column and move along the horizontal line to the US Dollar, the percentage change displayed in the box will represent JPY (base)/USD (quote).
Forex News
Keep up with the financial markets, know what's happening and what is affecting the markets with our latest market updates. Analyze market movers, trends and build your trading strategies accordingly.
