USD/INR remains flat, Indian WPI Inflation rises to 2.36% in October
- The Indian Rupee remains steady near a record low in Thursday's early European session.
- India’s Wholesale Price Index (WPI) Inflation rose to 2.36% YoY in October from 1.84% in September, hotter than the 2.20% expected.
- Equity outflows and persistent strength in the USD drag the INR lower.
- Investors await the US PPI on Thursday, along with Fedspeak.
The Indian Rupee (INR) flat lines near its all-time low on Thursday. India's Wholesale Price Index (WPI)-based inflation climbed to 2.36% YoY in October from 1.84% in the previous reading. This figure came in above the market consensus of 2.20%, according to the latest official data released on Thursday. The INR trades on a flat note despite the hotter Indian inflation report.
The continued withdrawal of foreign funds, sluggishness in domestic stock markets, and a rally in the US Dollar Index (DXY) exert some selling pressure on the local currency. Nonetheless, lower crude oil prices and the routine interventions by the Reserve Bank of India (RBI) might help limit the INR's losses and keep volatility muted in the near term. The US Producer Price Index (PPI) for October, weekly Initial Jobless Claims and Fedspeak will be the highlights later on Thursday.
Indian Rupee remains weaker amid foreign fund outflows and a strong US Dollar
- Overseas investors withdrew nearly $3 billion from Indian stocks in November, adding to the $11 billion of outflows in October. Indian equity indexes have fallen over 9% since their peak in late September.
- The US Consumer Price Index (CPI) rose by 2.6% YoY in October, in line with expectations, according to the US Department of Labor Statistics on Wednesday.
- The core CPI, which excludes the more volatile food and energy categories, climbed by 3.3% YoY in October, matching prior forecasts.
- Kansas Fed President Jeffrey Schmid stated on Wednesday that the Fed’s interest-rate cuts to date acknowledge its growing confidence that inflation is headed down but gave no steer on how many more rate cuts he feels may be appropriate, per Reuters.
- St. Louis Fed President Alberto Musalem noted on Wednesday that sticky inflation figures make it difficult for the US central bank to continue to ease rates.
- Dallas Fed President Lorie Logan said on Wednesday that the central bank should move slowly with additional rate cuts to avoid unintentionally stoking inflation.
USD/INR’s bullish outlook remains in play, but overbought conditions linger
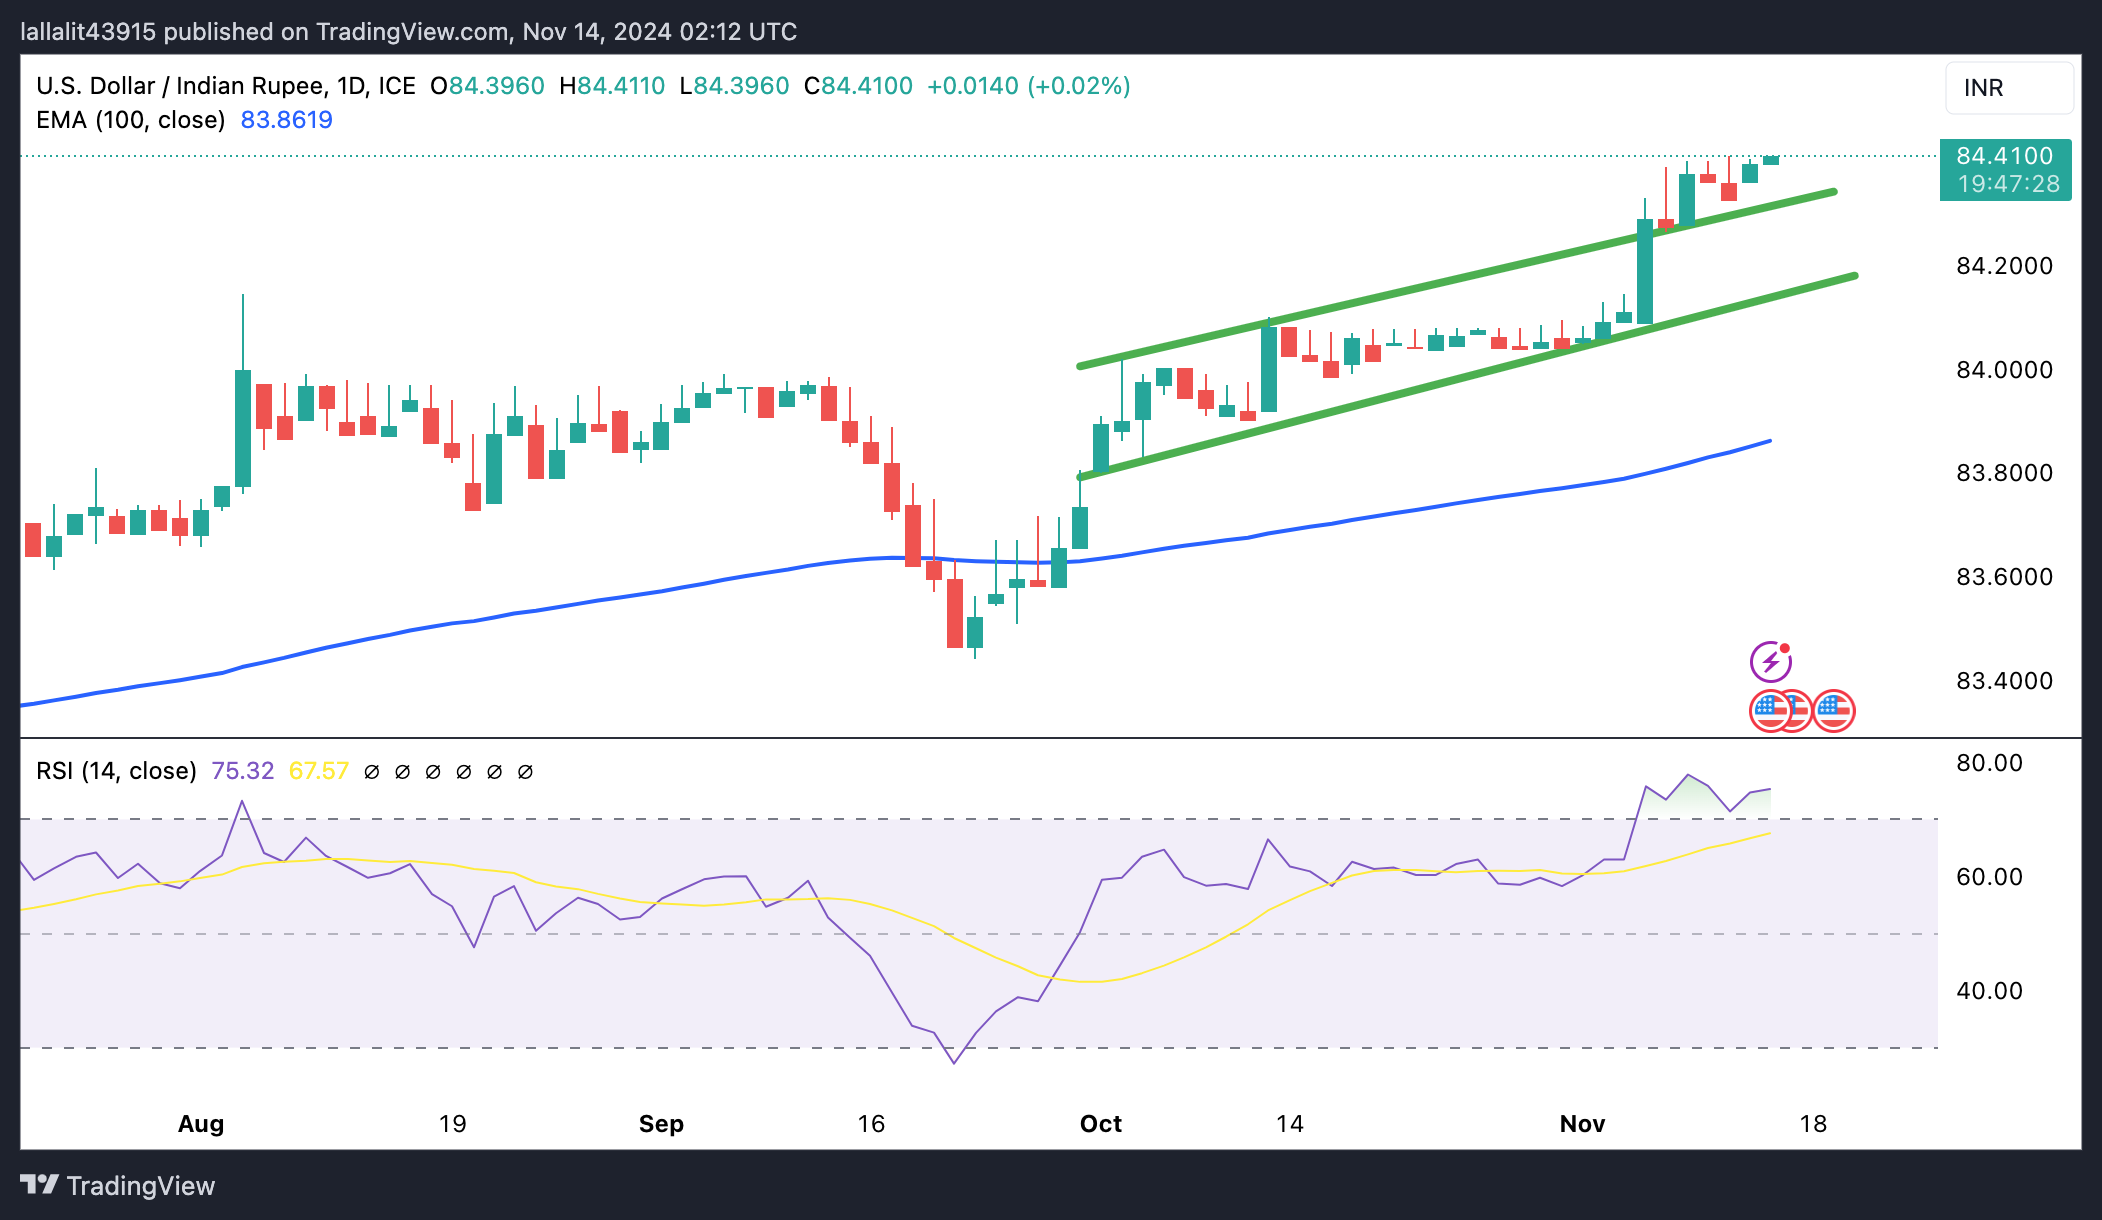
The Indian Rupee trades flat on the day. The USD/INR pair holds above the key 100-day Exponential Moving Average (EMA) on the daily timeframe, suggesting the uptrend is more likely to resume than to reverse. However, further consolidation cannot be ruled out before positioning for any near-term USD/INR appreciation as the 14-day Relative Strength Index (RSI) exceeds 70, indicating an overbought condition.
The first upside barrier for USD/INR is seen at 84.50. Sustained trading above this level potentially takes the pair to the 85.00 psychological level and beyond.
On the flip side, the resistance-turned-support level at 84.32 acts as an initial support for the pair. A breach of the mentioned level could see a drop to the 84.05-84.10 region, representing the lower limit of the trend channel and the high of October 11. The next contention level to watch is 83.86, the 100-day EMA. A decisive break below this level could mark the start of a downtrend.
Inflation FAQs
Inflation measures the rise in the price of a representative basket of goods and services. Headline inflation is usually expressed as a percentage change on a month-on-month (MoM) and year-on-year (YoY) basis. Core inflation excludes more volatile elements such as food and fuel which can fluctuate because of geopolitical and seasonal factors. Core inflation is the figure economists focus on and is the level targeted by central banks, which are mandated to keep inflation at a manageable level, usually around 2%.
The Consumer Price Index (CPI) measures the change in prices of a basket of goods and services over a period of time. It is usually expressed as a percentage change on a month-on-month (MoM) and year-on-year (YoY) basis. Core CPI is the figure targeted by central banks as it excludes volatile food and fuel inputs. When Core CPI rises above 2% it usually results in higher interest rates and vice versa when it falls below 2%. Since higher interest rates are positive for a currency, higher inflation usually results in a stronger currency. The opposite is true when inflation falls.
Although it may seem counter-intuitive, high inflation in a country pushes up the value of its currency and vice versa for lower inflation. This is because the central bank will normally raise interest rates to combat the higher inflation, which attract more global capital inflows from investors looking for a lucrative place to park their money.
Formerly, Gold was the asset investors turned to in times of high inflation because it preserved its value, and whilst investors will often still buy Gold for its safe-haven properties in times of extreme market turmoil, this is not the case most of the time. This is because when inflation is high, central banks will put up interest rates to combat it. Higher interest rates are negative for Gold because they increase the opportunity-cost of holding Gold vis-a-vis an interest-bearing asset or placing the money in a cash deposit account. On the flipside, lower inflation tends to be positive for Gold as it brings interest rates down, making the bright metal a more viable investment alternative.
Forex News
Keep up with the financial markets, know what's happening and what is affecting the markets with our latest market updates. Analyze market movers, trends and build your trading strategies accordingly.


