
NZD/JPY Price Analysis: Seller control the short term,overall trend remains bullist
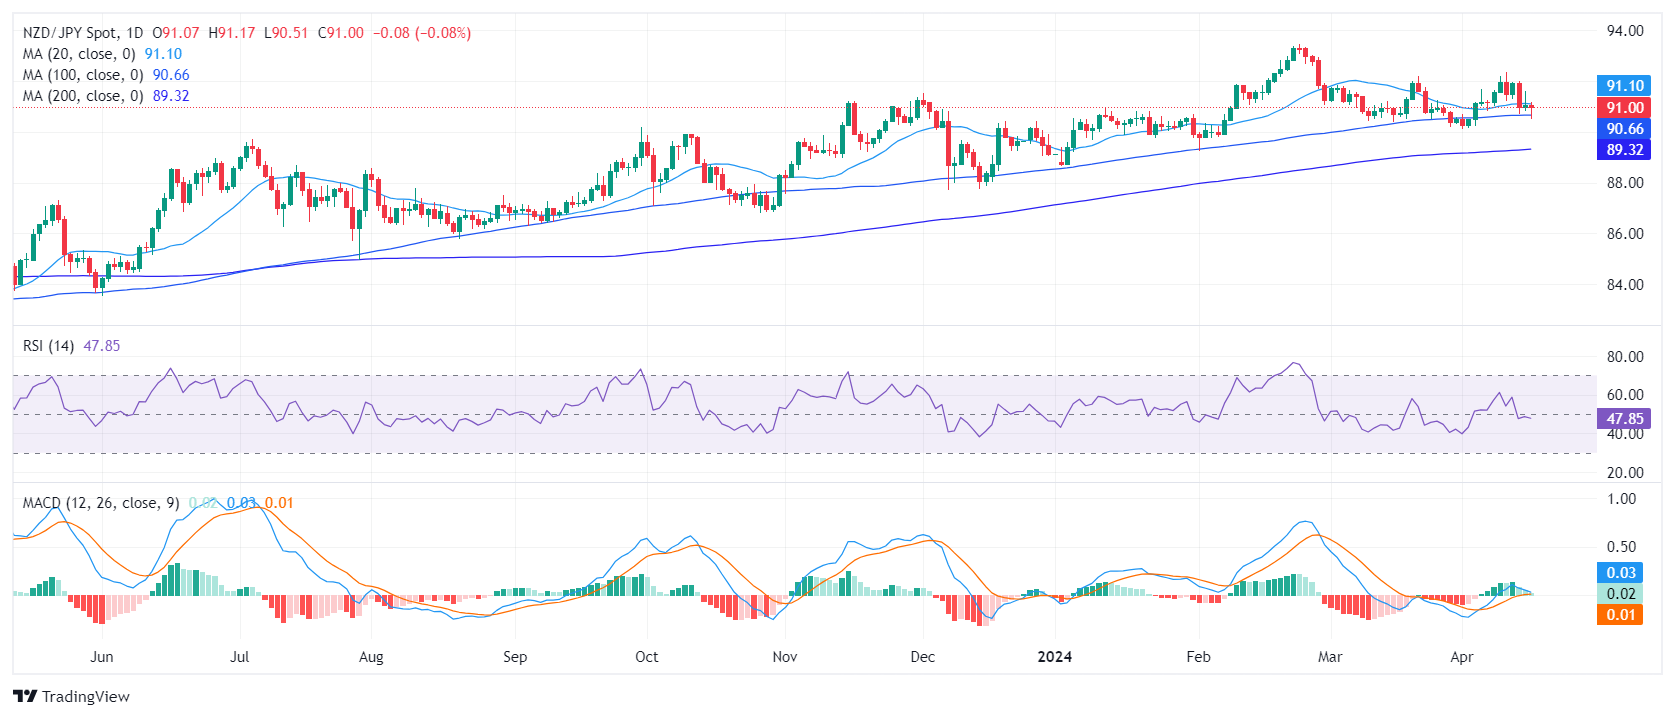
- The daily RSI reveals that market momentum is currently dominated by sellers.
- The daily MACD presents flat green bars, indicating a lack of buying traction.
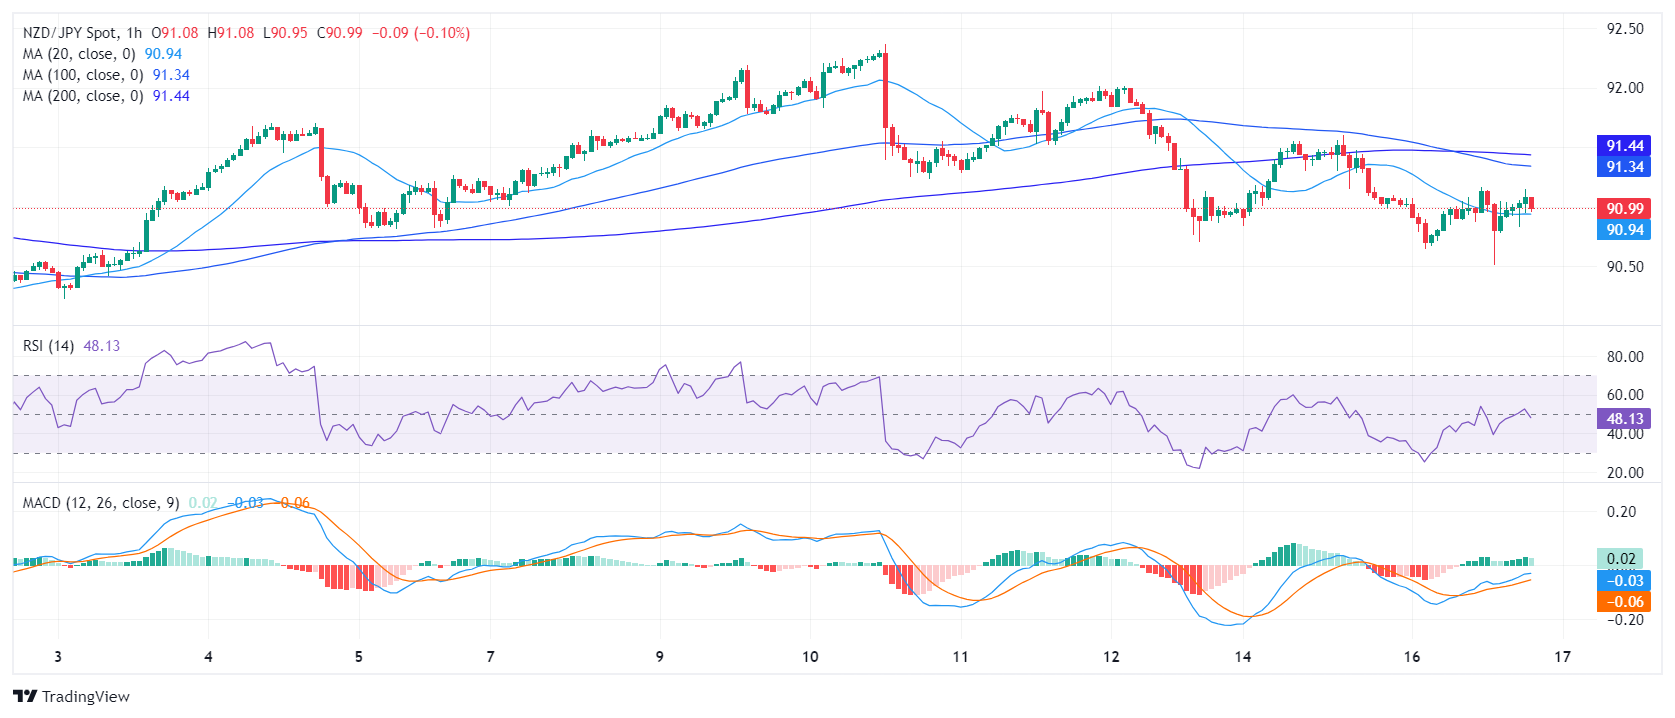
- In the hourly chart, the RSI shows slight improvement, suggesting sellers losing some ground.
The NZD/JPY stabilized at around 90.94 and managed to clear most of its daily losses. However, in the shorter time frames, there are signs of a bullish recovery.
The daily Relative Strength Index (RSI) hovers in the negative territory. The most recent reading fell to 48, reflecting a market momentum currently dominated by sellers. Furthermore, the Moving Average Convergence Divergence (MACD) histogram prints flat green bars, indicating a lack of positive momentum.
NZD/JPY daily chart
Transitioning to the hourly chart, the RSI seems to confirm the tepid sentiment observed on the daily chart. The most recent reading also lands in the 48 range. Nevertheless, signs of slight improvement towards the positive territory appear in the RSI and the latest session reading climbed from a preceding low of 41. Moreover, the MACD histogram on the hourly chart prints green bars, suggesting a possible pick-up in positive momentum.
NZD/JPY hourly chart
The broader outlook, on the other hand, suggests that the bulls control the overall trend, but as long as the buyers fail to reclaim the 20-day Simple Moving Average (SMA), the short-term outlook will remain tilted in favor of the buyers.
Forex News
Keep up with the financial markets, know what's happening and what is affecting the markets with our latest market updates. Analyze market movers, trends and build your trading strategies accordingly.