
Japanese Yen remains close to multi-month high against a broadly weaker USD
- The Japanese Yen attracts fresh buyers and draws support from a combination of factors.
- The prevalent risk-off environment and recession fears underpin the safe-haven JPY.
- Aggressive Fed rates weigh on the US bond yields, the USD, and the USD/JPY pair.
The Japanese Yen (JPY) reverses an intraday dip against its American counterpart and climbs back closer to the top end of the daily range heading into the European session on Monday. Investors remain worried that US President Donald Trump's tariffs would trigger an all-out global trade war and undermine economic growth around the world. Moreover, persistent geopolitical tensions lead to an extended sell-off in equity markets and offer some support to the safe-haven JPY.
Meanwhile, signs of broadening inflation in Japan keep the door open for further interest rate hikes by the Bank of Japan (BoJ) in 2025, which turn out to be another factor underpinning the JPY. The US Dollar (USD), on the other hand, meets with a fresh supply amid expectations that a tariffs-driven US economic slowdown, might force the Federal Reserve (Fed) To resume its rate-cutting cycle soon. This further contributes to the USD/JPY pair's slide back closer to the 145.00 psychological mark.
Japanese Yen bulls have the upper hand amid the US tariffs-inspired global flight to safety
- Asian stock markets and US equity futures tumbled at the start of a new week amid growing concerns about a widening global trade war and the mounting risk of recession. US President Donald Trump late last Wednesday imposed a 10% baseline tariff on all imports and higher duties on some of the country's biggest trading partners. In response, the European Union is all set to join China and Canada in imposing retaliatory tariffs.
- Investors scaled back their bets for early interest rate hikes by the Bank of Japan amid concerns that harsher-than-expected US tariffs could negatively impact Japan's economy. Japan's Chief Cabinet Secretary Yoshimasa Hayashi said this Monday that US tariffs are expected to have a big impact on Japan-US economic relations. This, in turn, fails to assist the safe-haven Japanese Yen to capitalize on its modest Asian session gains.
- In its quarterly regional economic report published on Monday, the BoJ maintains the assessment for all of Japan's nine regions.
- Meanwhile, Japan's Prime Minister Shigeru Ishiba said late Sunday that the country would continue pressing the US to lower tariffs on Japanese goods, but acknowledged that progress was unlikely to come overnight. Ishiba added that he is aiming to have a call with Trump this week and also emphasized the importance of domestic support measures in the meantime. This, however, does little to impress the JPY bulls.
- The US Dollar preserves Friday's modest recovery gains led by the stronger-than-anticipated US Nonfarm Payrolls (NFP) report and hawkish comments from Federal Reserve Chair Jerome Powell. The US Bureau of Labor Statistics (BLS) reported that the economy added 228,000 new jobs in March as compared to the 135,000 market expectations and the previous month's downwardly revised reading of 117,000.
- Powell acknowledged that Trump's tariffs could have a stronger-than-anticipated inflationary and economic impact, though policy changes remain on hold for now. Powell stated that inflation is closer to target but still slightly elevated and that the Fed’s job is to avoid temporary price hikes turning into persistent inflation. The Fed is monitoring uncertainty from the Trump administration's trade policies, Powell added further.
- Market participants, however, seem convinced that the US central bank will resume its rate-cutting cycle at the June policy meeting and lower borrowing costs at least four times by the end of this year to bail out the economy. This, along with the anti-risk flow, drags the yield on the benchmark 10-year US government bond further below the 4.0% mark and might hold back the USD bulls from placing aggressive bets.
USD/JPY seems vulnerable to slide further; break below the 61.8% Fibo. level in play
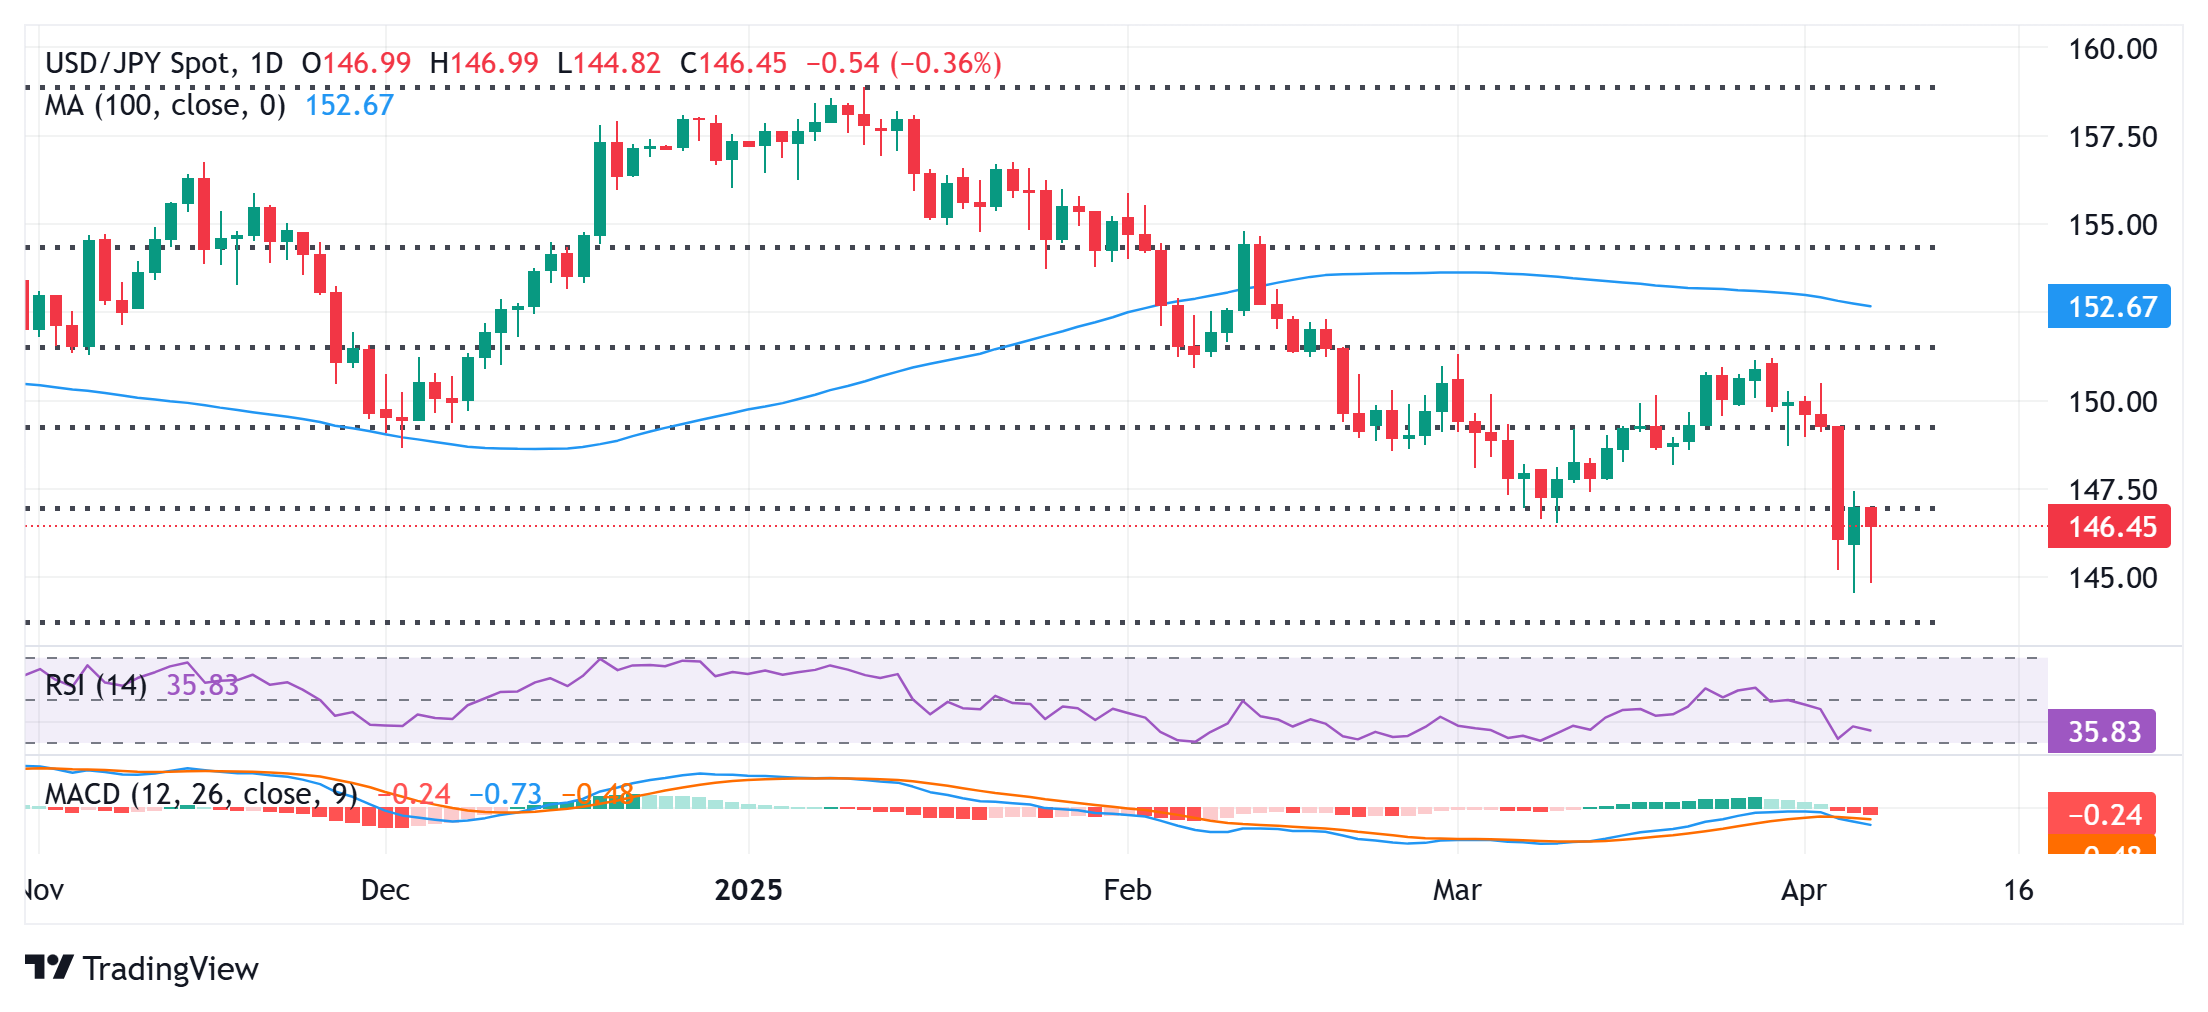
From a technical perspective, last week's breakdown and acceptance below the 61.8% Fibonacci retracement level of the September-March positive move was seen as a fresh trigger for the USD/JPY bears. Moreover, oscillators on the daily chart are holding deep in negative territory and are still away from being in the oversold zone. This, in turn, suggests that the path of least resistance for spot prices remains to the downside. Hence, any subsequent recovery beyond the 147.00 mark (61.8% Fibo. level) might be seen as a selling opportunity and remain capped near the 147.70 region. This is followed by the 148.00 round figure, which if cleared decisively might trigger a near-term short-covering rally.
On the flip side, the 146.00 mark, followed by the 145.45 region, the 145.00 psychological mark Asian session low, around the 144.80 region, and a multi-month trough, around the 144.55 region touched on Friday, could act as immediate support levels. Some follow-through selling below the latter will reaffirm the negative bias and make the USD/JPY pair vulnerable to accelerate the downfall further toward the 144.00 round figure.
US Dollar PRICE Today
The table below shows the percentage change of US Dollar (USD) against listed major currencies today. US Dollar was the strongest against the Australian Dollar.
| USD | EUR | GBP | JPY | CAD | AUD | NZD | CHF | |
|---|---|---|---|---|---|---|---|---|
| USD | -0.72% | -0.30% | -0.20% | -0.17% | 0.43% | 0.14% | -1.01% | |
| EUR | 0.72% | 0.70% | 1.14% | 1.17% | 1.10% | 1.49% | 0.32% | |
| GBP | 0.30% | -0.70% | -0.86% | 0.47% | 0.40% | 0.79% | -0.37% | |
| JPY | 0.20% | -1.14% | 0.86% | 0.07% | 1.62% | 1.60% | -0.45% | |
| CAD | 0.17% | -1.17% | -0.47% | -0.07% | 0.26% | 0.31% | -1.10% | |
| AUD | -0.43% | -1.10% | -0.40% | -1.62% | -0.26% | 0.39% | -0.76% | |
| NZD | -0.14% | -1.49% | -0.79% | -1.60% | -0.31% | -0.39% | -1.15% | |
| CHF | 1.01% | -0.32% | 0.37% | 0.45% | 1.10% | 0.76% | 1.15% |
The heat map shows percentage changes of major currencies against each other. The base currency is picked from the left column, while the quote currency is picked from the top row. For example, if you pick the US Dollar from the left column and move along the horizontal line to the Japanese Yen, the percentage change displayed in the box will represent USD (base)/JPY (quote).
Forex News
Keep up with the financial markets, know what's happening and what is affecting the markets with our latest market updates. Analyze market movers, trends and build your trading strategies accordingly.