GBP/USD Price Forecast: Upbeat UK data fuels rally, stalls at 1.3050
- GBP/USD rebounds from a weekly low of 1.2974, driven by stronger-than-expected UK Retail Sales data.
- Momentum favors sellers, but a break above 1.3102 could lead to further gains, with resistance at 1.3129 and 1.3175.
- A daily close below 1.3100 may expose the pair to downside risks, with key support at 1.3000 and the 100-DMA at 1.2957.
The Pound Sterling resumed its uptrend after hitting a weekly low of 1.2974 on Wednesday. It surged after the UK Retail Sales data was stronger than foreseen by market analysts, portraying a robust economy. Nevertheless, traders remain convinced that the Bank of England (BoE) would lower rates as inflation fell below the bank’s 2% target. At the time of writing, the GBP/USD trades at 1.3036.
GBP/USD Price Forecast: Technical outlook
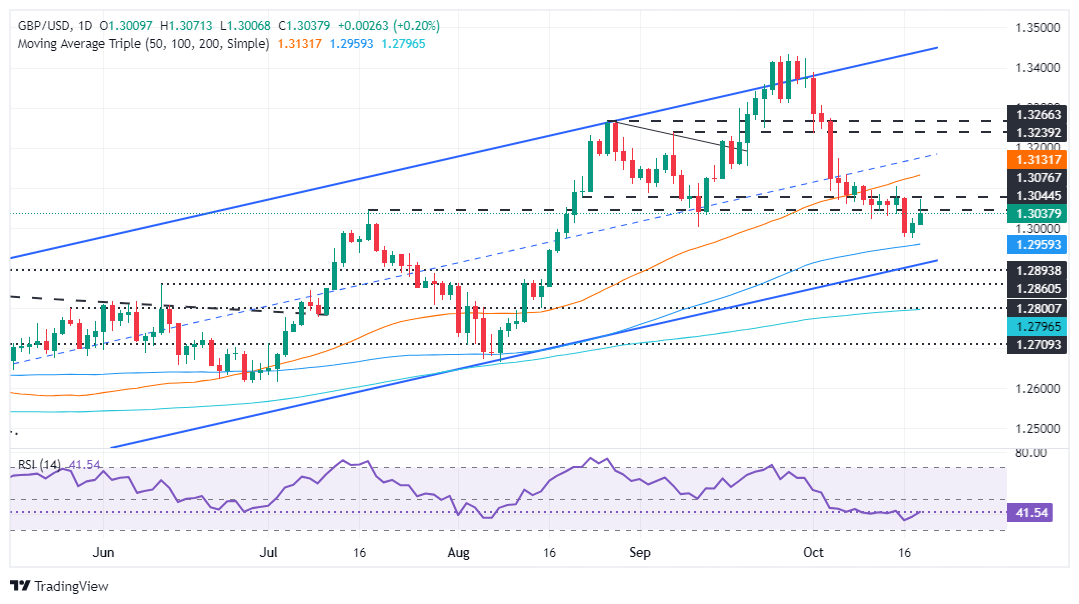
The GBP/USD is upward biased, though downside risks remain unless the pair clears the October 15 high at 1.3102. Failure to do so could cause sellers to remain hopeful of lowering spot prices.
As of late, momentum suggests that sellers are in charge. The Relative Strength Index (RSI) is bearish, though it aims higher, but it is far from reaching neutral readings.
If GBP/USD surpasses 1.3102, buyers will face stir resistance at the 50-day moving average (DMA) at 1.3129. A breach of the latter will expose the October 4 peak at 1.3175, ahead of 1.3200.
Conversely, a daily close below 1.3100 could pave the way for further downside. The first support would be the 1.3000 figure, followed by the weekly low of 1.2974. Below lies the 100-DMA at 1.2957, followed by the 1.2900 mark.
GBP/USD Price Action – Daily Chart
British Pound PRICE Today
The table below shows the percentage change of British Pound (GBP) against listed major currencies today. British Pound was the strongest against the Canadian Dollar.
| USD | EUR | GBP | JPY | CAD | AUD | NZD | CHF | |
|---|---|---|---|---|---|---|---|---|
| USD | -0.23% | -0.22% | -0.43% | 0.08% | -0.13% | -0.16% | -0.06% | |
| EUR | 0.23% | 0.04% | -0.19% | 0.31% | 0.09% | 0.08% | 0.18% | |
| GBP | 0.22% | -0.04% | -0.23% | 0.28% | 0.07% | 0.05% | 0.11% | |
| JPY | 0.43% | 0.19% | 0.23% | 0.53% | 0.30% | 0.26% | 0.35% | |
| CAD | -0.08% | -0.31% | -0.28% | -0.53% | -0.21% | -0.24% | -0.18% | |
| AUD | 0.13% | -0.09% | -0.07% | -0.30% | 0.21% | -0.03% | 0.04% | |
| NZD | 0.16% | -0.08% | -0.05% | -0.26% | 0.24% | 0.03% | 0.07% | |
| CHF | 0.06% | -0.18% | -0.11% | -0.35% | 0.18% | -0.04% | -0.07% |
The heat map shows percentage changes of major currencies against each other. The base currency is picked from the left column, while the quote currency is picked from the top row. For example, if you pick the British Pound from the left column and move along the horizontal line to the US Dollar, the percentage change displayed in the box will represent GBP (base)/USD (quote).
Forex News
Keep up with the financial markets, know what's happening and what is affecting the markets with our latest market updates. Analyze market movers, trends and build your trading strategies accordingly.