
EUR/USD tumbles as fears of potential EU-US trade war outplay soft US PPI
- EUR/USD falls sharply to near 1.0820 as investors turn cautious over the EU-US trade relationship outlook.
- US President Trump threatens to respond to EU’s proposed counter-tariffs.
- Investors await the meeting of German leaders on a debt restructuring plan.
EUR/USD slumps to near 1.0820 in North American trading hours on Thursday. The major currency pair tumbles as the US Dollar (USD) gains ground amid increased demand for safe-haven assets due to United States (US) President Trump’s tariff policies. The US Dollar Index (DXY), which tracks the Greenback’s value against six major currencies, jumps to near 104.00 after recovering from its four-month low of 103.20.
The Greenback recovers despite US consumer and producer inflation having cooled down faster than expected in February. In the 12 months to February, the headline PPI rose by 3.2%, slower than estimates of 3.3% and the 3.7% increase seen in January. In the same period, the core PPI – which excludes volatile food and energy prices – decelerated at a faster pace to 3.4% from expectations of 3.5% and the former reading of 3.8%. Month-on-month core PPI deflated by 0.1% while the headline figure remained flat.
Signs of taming inflationary pressures bode poorly for the US Dollar as they force traders to raise bets supporting the Federal Reserve (Fed) to ease monetary policy. According to the CME FedWatch tool, there is a 76% chance that the Fed will cut interest rates in the June meeting.
Going forward, the next major trigger for the US Dollar will be the two-day Fed’s monetary policy meeting on March 18-19. The central bank is almost certain to keep interest rates steady in the range of 4.25%-4.50%. Investors will pay close attention to the Fed’s guidance on inflation and the economic outlook under the leadership of Donald Trump.
Daily digest market movers: EUR/USD slides as Euro underperforms
- A sharp corrective move in the EUR/USD pair is also driven by weakness in Euro (EUR) on fresh escalation in potential tariff war between the European Union (EU) and the US. On Wednesday, US President Donald Trump said that he would respond to counter-tariffs proposed by the EU on 26 billion Euro worth of US goods. Trump’s comments came just before the meeting with Irish Prime Minister Micheál Martin, after which he said that “there’s a massive deficit that we have with Ireland and with other countries” and added he will impose reciprocal tariffs on them for taking advantage of the US.
- During the European trading hours on Wednesday, European Commission (EC) President Ursula von der Leyen launched 'swift and proportionate countermeasures' on US imports in the EU in response to steel tariffs. Trump announced a 25% tariff blanket on imports of steel and aluminum, which has come into effect on Thursday. Contrary to the EC's counter-tariff announcement, European Central Bank (ECB) policymaker and Governor of the Bank of Finland said during European trading hours on Thursday that the EU should aim at "negotiated solutions for US tariffs," encouraging the Trump administration to avoid these unnecessary, "harmful tariffs."
- The trade war between the shared continent and the US will impact heavily on the German economy, knowing that it is the largest exporter of the Eurozone to the US. In European trading hours on Thursday, the European Central Bank (ECB) policymaker and Bundesbank President Joachim Nagel warned that US trade tariffs on the European Union (EU) could push “Germany into recession this year” in an interview with BBC News.
- Meanwhile, trades are also cautious ahead of the meeting of German leaders to discuss the debt restructuring to boost defense spending and stimulate economic growth. German debt reforms are expected to get cleared in the lower house of Parliament on Tuesday as Franziska Brantner-led-German Green Party agreed to negotiate with likely next Chancellor Friedrich Merz and Social Democratic Party’s (SDP) co-leader Lars Klingbei.
- The Euro has outperformed lately as investors expect the German debt restructuring plan will be inflationary for the economy. Such a scenario would force traders to pare European Central Bank (ECB) dovish bets.
Euro PRICE Today
The table below shows the percentage change of Euro (EUR) against listed major currencies today. Euro was the strongest against the New Zealand Dollar.
| USD | EUR | GBP | JPY | CAD | AUD | NZD | CHF | |
|---|---|---|---|---|---|---|---|---|
| USD | 0.55% | 0.28% | 0.01% | 0.16% | 0.76% | 0.77% | 0.21% | |
| EUR | -0.55% | -0.26% | -0.53% | -0.40% | 0.21% | 0.25% | -0.34% | |
| GBP | -0.28% | 0.26% | -0.27% | -0.13% | 0.47% | 0.51% | -0.05% | |
| JPY | -0.01% | 0.53% | 0.27% | 0.11% | 0.74% | 0.76% | 0.23% | |
| CAD | -0.16% | 0.40% | 0.13% | -0.11% | 0.62% | 0.64% | 0.08% | |
| AUD | -0.76% | -0.21% | -0.47% | -0.74% | -0.62% | 0.04% | -0.49% | |
| NZD | -0.77% | -0.25% | -0.51% | -0.76% | -0.64% | -0.04% | -0.52% | |
| CHF | -0.21% | 0.34% | 0.05% | -0.23% | -0.08% | 0.49% | 0.52% |
The heat map shows percentage changes of major currencies against each other. The base currency is picked from the left column, while the quote currency is picked from the top row. For example, if you pick the Euro from the left column and move along the horizontal line to the US Dollar, the percentage change displayed in the box will represent EUR (base)/USD (quote).
Technical Analysis: EUR/USD falls to near 1.0800
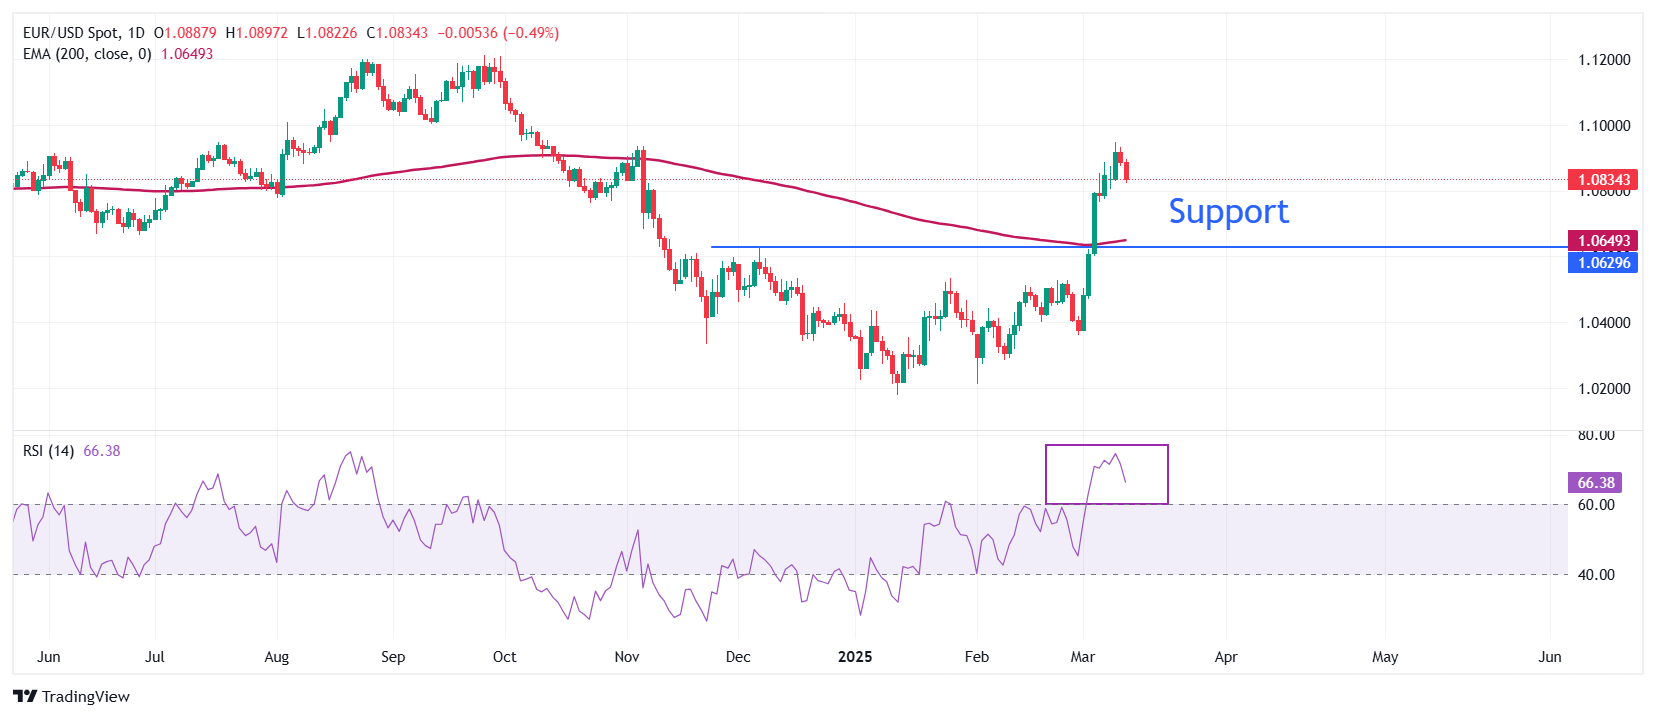
EUR/USD drops vertically to nearr 1.0820 on Thursday, extending correction after posting a fresh five-month high near 1.0950 on Tuesday. However, the long-term outlook of the major currency pair is bullish as it holds above the 200-day Exponential Moving Average (EMA), which trades around 1.0650.
The 14-day Relative Strength Index (RSI) holds above 60.00, suggesting that the bullish momentum is intact
Looking down, the December 6 high of 1.0630 will act as the major support zone for the pair. Conversely, the psychological level of 1.1000 will be a key barrier for the Euro bulls.
Forex News
Keep up with the financial markets, know what's happening and what is affecting the markets with our latest market updates. Analyze market movers, trends and build your trading strategies accordingly.