Australian Dollar weakens as US-China negotiations remain stalled
- The Australian Dollar comes under pressure from deepening deflationary concerns in China.
- Westpac Consumer Confidence climbed 4% to 95.9 in March, up from 92.2 in February, reaching its highest level in three years.
- President Trump described the economy as being in a "transition period," signaling a potential slowdown.
The Australian Dollar (AUD) loses ground against the US Dollar (USD) for the fourth consecutive session on Tuesday. Despite a stronger Westpac Consumer Confidence reading—rising 4% to 95.9 in March from 92.2 in February, marking its highest level in three years—the AUD/USD pair continues to struggle. The uptick in sentiment was driven by the Reserve Bank of Australia's (RBA) interest rate cut in February and easing cost-of-living pressures.
Australia’s 10-year government bond yield declined to around 4.39% as escalating global trade tensions dampened investor risk appetite. China's retaliatory tariffs on select United States (US) agricultural products took effect on Monday, following Washington’s recent tariff hike from 10% to 20% on Chinese imports. Given China’s status as Australia’s largest trading partner, these developments have weighed on market sentiment.
Traders remain focused on the RBA’s policy outlook, especially after last week’s strong economic data tempered expectations of further rate cuts. Economic growth exceeded forecasts, marking its first acceleration in over a year. Additionally, the latest RBA Meeting Minutes signaled a cautious approach to monetary policy, clarifying that February’s rate cut does not imply a commitment to ongoing easing.
Bloomberg reported on Tuesday, citing sources familiar with the matter, that trade and other negotiations between the US and China remain at a deadlock. Chinese officials state that the US has not provided clear steps regarding fentanyl measures needed for tariff relief. Meanwhile, a source familiar with White House discussions indicated that no plans are currently underway for an in-person meeting between the two leaders.
With the Federal Reserve entering its blackout period ahead of the March 19 meeting, central bank commentary will be limited this week. Investors are now looking ahead to February’s Consumer Price Index (CPI) release on Wednesday for further insights into inflation trends.
Australian Dollar faces challenges amid escalating global trade tensions
- The US Dollar Index (DXY), which tracks the US Dollar against six major currencies, remains subdued and is trading around 103.80 at the time of writing. Concerns over tariff policy uncertainty potentially pushing the US economy into recession have weighed on the Greenback.
- Weaker-than-expected US job data for February reinforced expectations that the Federal Reserve (Fed) will proceed with multiple rate cuts this year. According to LSEG data, traders are now pricing in a total of 75 basis points (bps) in rate cuts, with a June cut fully anticipated.
- President Trump characterized the economy as being in a "transition period," hinting at a potential slowdown. Investors took his remarks as an early signal of possible economic turbulence in the near future.
- The US Bureau of Labor Statistics (BLS) showed on Friday that Nonfarm Payrolls (NFP) increased by 151,000 in February, falling short of the expected 160,000. January’s job growth was also revised downward to 125,000 from the previously reported 143,000.
- Last week, Fed Chair Jerome Powell reassured markets that the central bank sees no immediate need to adjust monetary policy despite rising uncertainties. San Francisco Fed President Mary Daly echoed this sentiment, noting that increasing business uncertainty could dampen demand but does not justify an interest rate change.
- US Commerce Secretary Howard Lutnick stated on Sunday that the 25% tariffs, imposed by President Donald Trump in February, on steel and aluminum imports, set to take effect on Wednesday, are unlikely to be postponed, according to Bloomberg. While US steelmakers have urged Trump to maintain the tariffs, businesses reliant on these materials may face increased costs.
- President Trump stated on Sunday that he anticipates a positive outcome from the US discussions with Ukrainian officials in Saudi Arabia. Trump also mentioned that his administration has considered lifting an intelligence pause on Ukraine, is evaluating various aspects of tariffs on Russia, and is not worried about military exercises involving Russia, China, and Iran, according to Reuters.
- RBA Deputy Governor Andrew Hauser highlighted that global trade uncertainty is at a 50-year high. Hauser warned that uncertainty stemming from US President Donald Trump's tariffs could prompt businesses and households to delay planning and investment, potentially weighing on economic growth.
- China announced on Saturday that it will impose a 100% tariff on Canadian rapeseed oil, oil cakes, and peas, along with a 25% levy on aquatic products and pork from Canada. The move comes as retaliation against tariffs introduced by Canada in October, escalating trade tensions. This marks a new front in a broader trade conflict driven by US President Donald Trump's tariff policies. The tariffs are set to take effect on March 20.
- China’s Consumer Price Index fell by 0.7% year-over-year in February, exceeding market expectations of a 0.5% decline and reversing the 0.5% increase recorded in the previous month. This marks the first instance of consumer deflation since January 2024, driven by weakening seasonal demand after the Spring Festival in late January. On a monthly basis, CPI inflation stood at -0.2% in February, down from January’s 0.7% and softer than the expected -0.1%.
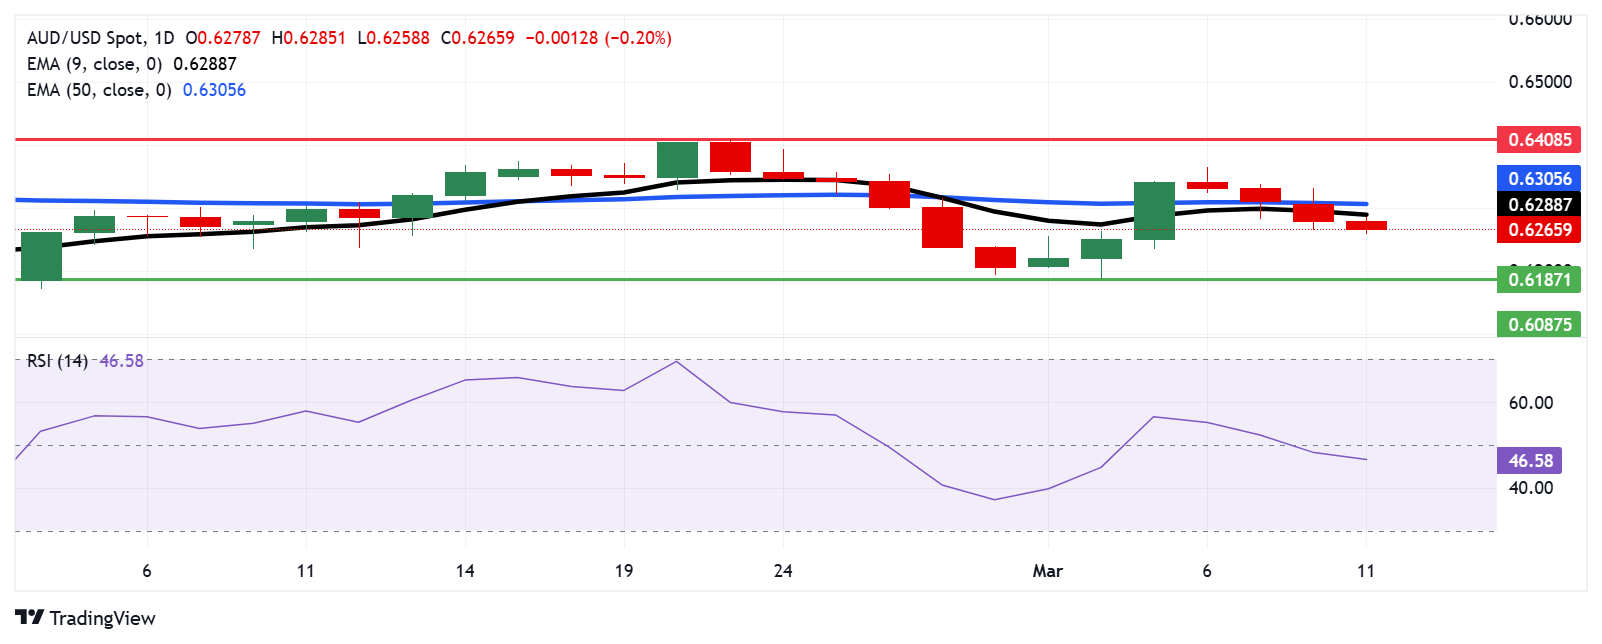
Technical Analysis: Australian Dollar falls to near 0.6250 as bearish momentum strengthens
The AUD/USD pair is trading near 0.6260 on Tuesday, with technical analysis of the daily chart showing the pair slipping below the nine-day Exponential Moving Average (EMA), signaling weakening short-term momentum. Additionally, the 14-day Relative Strength Index (RSI) has fallen below 50, indicating a shift toward a bearish bias.
On the downside, the AUD/USD pair could navigate the region around the five-week low of 0.6187, recorded on March 5.
The nine-day EMA at 0.6288 serves as the immediate resistance for the AUD/USD pair, followed by the 50-day EMA at 0.6305. A break above this level could strengthen short-term momentum, potentially pushing the pair toward the three-month high of 0.6408, last reached on February 21.
AUD/USD: Daily Chart
Australian Dollar PRICE Today
The table below shows the percentage change of Australian Dollar (AUD) against listed major currencies today. Australian Dollar was the weakest against the Swiss Franc.
| USD | EUR | GBP | JPY | CAD | AUD | NZD | CHF | |
|---|---|---|---|---|---|---|---|---|
| USD | -0.18% | -0.13% | -0.19% | -0.07% | 0.04% | 0.07% | -0.22% | |
| EUR | 0.18% | 0.06% | -0.02% | 0.11% | 0.22% | 0.26% | -0.02% | |
| GBP | 0.13% | -0.06% | -0.06% | 0.05% | 0.16% | 0.20% | -0.09% | |
| JPY | 0.19% | 0.02% | 0.06% | 0.11% | 0.23% | 0.25% | -0.03% | |
| CAD | 0.07% | -0.11% | -0.05% | -0.11% | 0.11% | 0.15% | -0.15% | |
| AUD | -0.04% | -0.22% | -0.16% | -0.23% | -0.11% | 0.04% | -0.24% | |
| NZD | -0.07% | -0.26% | -0.20% | -0.25% | -0.15% | -0.04% | -0.29% | |
| CHF | 0.22% | 0.02% | 0.09% | 0.03% | 0.15% | 0.24% | 0.29% |
The heat map shows percentage changes of major currencies against each other. The base currency is picked from the left column, while the quote currency is picked from the top row. For example, if you pick the Australian Dollar from the left column and move along the horizontal line to the US Dollar, the percentage change displayed in the box will represent AUD (base)/USD (quote).
Forex News
Keep up with the financial markets, know what's happening and what is affecting the markets with our latest market updates. Analyze market movers, trends and build your trading strategies accordingly.