Pound Sterling weakens against US Dollar as investors see Trump tariffs less fearful
- The Pound Sterling falls back from its intraday high against the US Dollar despite some investors seeing Trump's tariffs agenda as a tactic to close deals in a better position.
- UK’s upbeat Retail Sales, hot inflation, and strong wage growth are expected to weigh heavily on BoE's dovish bets.
- Investors await the preliminary S&P Global US PMI data for February.
The Pound Sterling (GBP) falls back after posting a fresh two-month high near 1.2680 against the US Dollar in North American trading hours on Friday. The GBP/USD pair surrenders intraday gains and turns negative as the US Dollar bounces back. The US Dollar Index (DXY), which tracks the Greenback’s value against six major currencies, rebounds to near 106.65 from its Year-To-Date (YTD) low of around 106.30, which it posted on Thursday.
On Thursday, the Greenback tumbled as its risk premium had diminished, with investors anticipating that United States (US) President Donald Trump’s tariff agenda won’t lead to a significant slowdown in the global economy.
Till now, President Trump has imposed 25% tariffs on aluminum and steel and 10% on all imports from China. He has threatened to impose a 25% levy on cars, semiconductors, and pharmaceuticals and the introduction of reciprocal tariffs without any detail and timeline. Investors had anticipated that Trump would announce a slew of tariffs soon after returning to the White House in January, based on his comments in the election campaign, which has forced them to believe that Trump’s tariff policies are just a ‘tactic’ to have the upper hand while having negotiations with his allies.
On the monetary policy front, Federal Reserve (Fed) officials have been guiding a restrictive monetary policy stance. On Thursday, Fed Governor Adriana Kugler said that the central bank should keep borrowing rates “in place” for “some time,” noting the net effect of new economic policies is “highly uncertain” and will depend on the “specifics.”
Daily digest market movers: Pound Sterling demonstrates discrete performance against its peers
- The Pound Sterling exhibits a mixed performance against its major peers on Friday after the release of robust United Kingdom (UK) Retail Sales data for January. The Office for National Statistics (ONS) reported that Retail Sales, a key measure of consumer spending, rose at a robust pace of 1.7% in the month after contracting by 0.6% in December, revised lower from -0.3%. Economists expected the consumer spending measure to have grown at a moderate pace of 0.3%.
- Year-on-year Retail Sales rose by 1%, beating the estimate of 0.6%, but remained lower than the 2.8% growth seen in 12 months to December.
- Upbeat Retail Sales data is expected to force traders to further pare their bets on the Bank of England (BoE) cutting interest rates again in the March meeting. The BoE's dovish bets were already challenged by a hotter-than-expected Consumer Price Index (CPI) report for January and strong Average Earnings data in the three months ending December.
- However, investors are unlikely to become increasingly optimistic about the British currency’s outlook as BoE Governor Andrew Bailey remains concerned over economic prospects this year. Earlier this week, Bailey warned that the economic growth is expected to remain sluggish. In the monetary policy meeting earlier this month, the BoE halved its annual Gross Domestic Product (GDP) forecasts for the year to 0.75%.
- Meanwhile, flash S&P Global/CIPS Purchasing Managers Index (PMI) data for February has come in line with estimates. The Composite PMI expanded at a slower pace to 50.5 from 50.6 in January. Activities in the manufacturing and services sectors contracted and expanded, respectively, at a surprisingly faster pace.
British Pound PRICE Today
The table below shows the percentage change of the British Pound (GBP) against listed major currencies today. British Pound was the strongest against the Japanese Yen.
| USD | EUR | GBP | JPY | CAD | AUD | NZD | CHF | |
|---|---|---|---|---|---|---|---|---|
| USD | 0.26% | 0.20% | 0.56% | 0.05% | 0.31% | 0.15% | 0.22% | |
| EUR | -0.26% | -0.07% | 0.30% | -0.21% | 0.05% | -0.12% | -0.05% | |
| GBP | -0.20% | 0.07% | 0.38% | -0.14% | 0.10% | -0.05% | 0.02% | |
| JPY | -0.56% | -0.30% | -0.38% | -0.47% | -0.24% | -0.41% | -0.34% | |
| CAD | -0.05% | 0.21% | 0.14% | 0.47% | 0.24% | 0.09% | 0.15% | |
| AUD | -0.31% | -0.05% | -0.10% | 0.24% | -0.24% | -0.15% | -0.10% | |
| NZD | -0.15% | 0.12% | 0.05% | 0.41% | -0.09% | 0.15% | 0.07% | |
| CHF | -0.22% | 0.05% | -0.02% | 0.34% | -0.15% | 0.10% | -0.07% |
The heat map shows percentage changes of major currencies against each other. The base currency is picked from the left column, while the quote currency is picked from the top row. For example, if you pick the British Pound from the left column and move along the horizontal line to the US Dollar, the percentage change displayed in the box will represent GBP (base)/USD (quote).
Technical Analysis: Pound Sterling aims to stabilize above 38.2% Fibo retracement
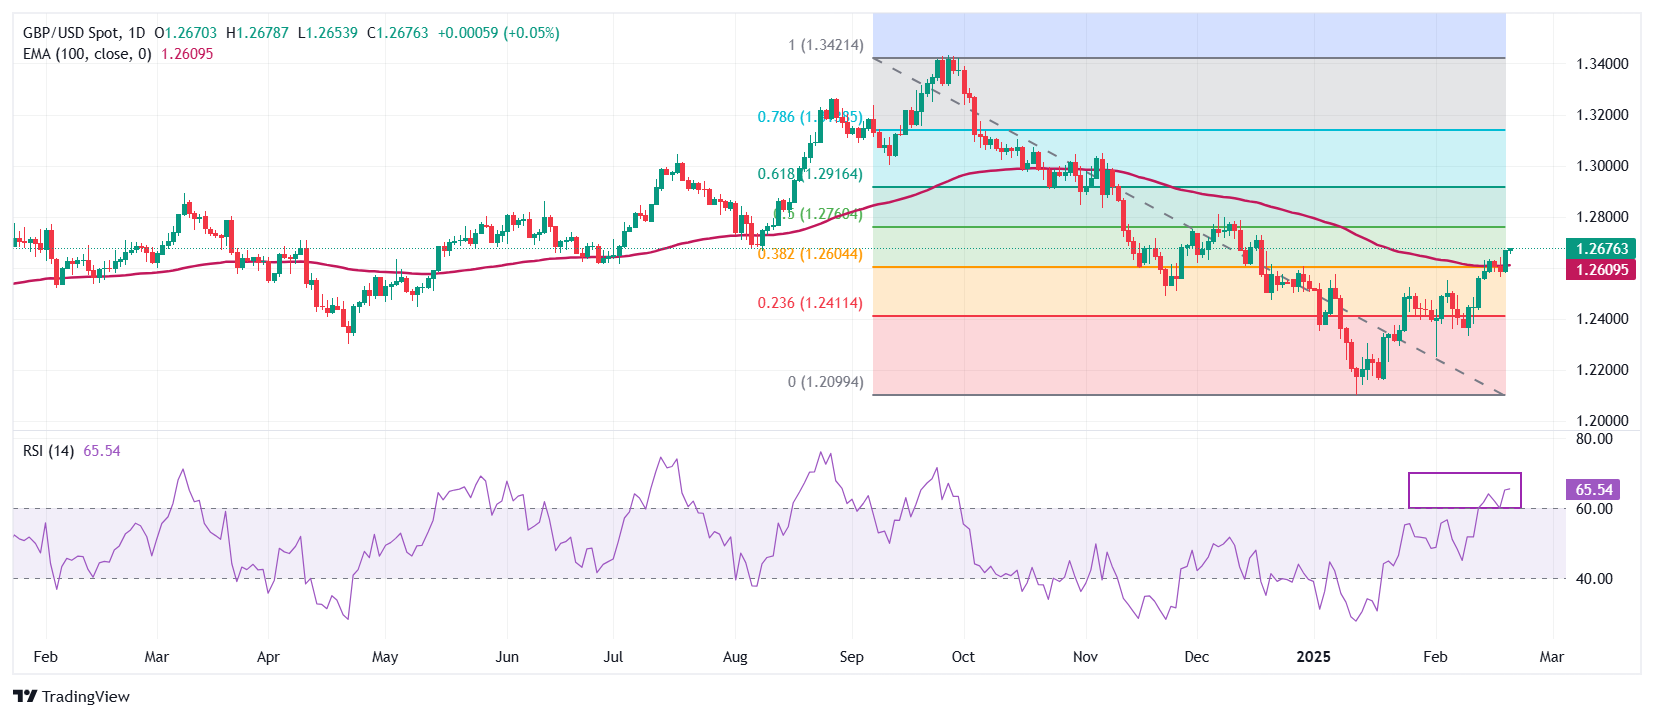
The Pound Sterling posts a fresh two-month high against the US Dollar near 1.2680 on Friday. The GBP/USD strengthens after breaking above the 38.2% Fibonacci retracement from the end-September high to the mid-January low downtrend, which coincided with the 100-day Exponential Moving Average (EMA), around 1.2620.
The 14-day Relative Strength Index (RSI) holds above 60.00. The bullish momentum would fizzle out if the RSI (14) fails to sustain above that level.
Looking down, the February 11 low of 1.2333 will act as a key support zone for the pair. On the upside, the 50% Fibonacci retracement at 1.2767 will act as a key resistance zone.
Forex News
Keep up with the financial markets, know what's happening and what is affecting the markets with our latest market updates. Analyze market movers, trends and build your trading strategies accordingly.