EUR/GBP Price Analysis: Downtrend stalls at key support level
- EUR/GBP has fallen to a tough support level and stalled.
- The pair remains in a short and medium-term downtrend with some bullish signs complicating the picture.
EUR/GBP finds support at the June 14 lows and consolidates. The pair has been in a downtrend after breaking out of a sideways consolidation or wedge pattern which formed between February and May.
EUR/GBP Daily Chart
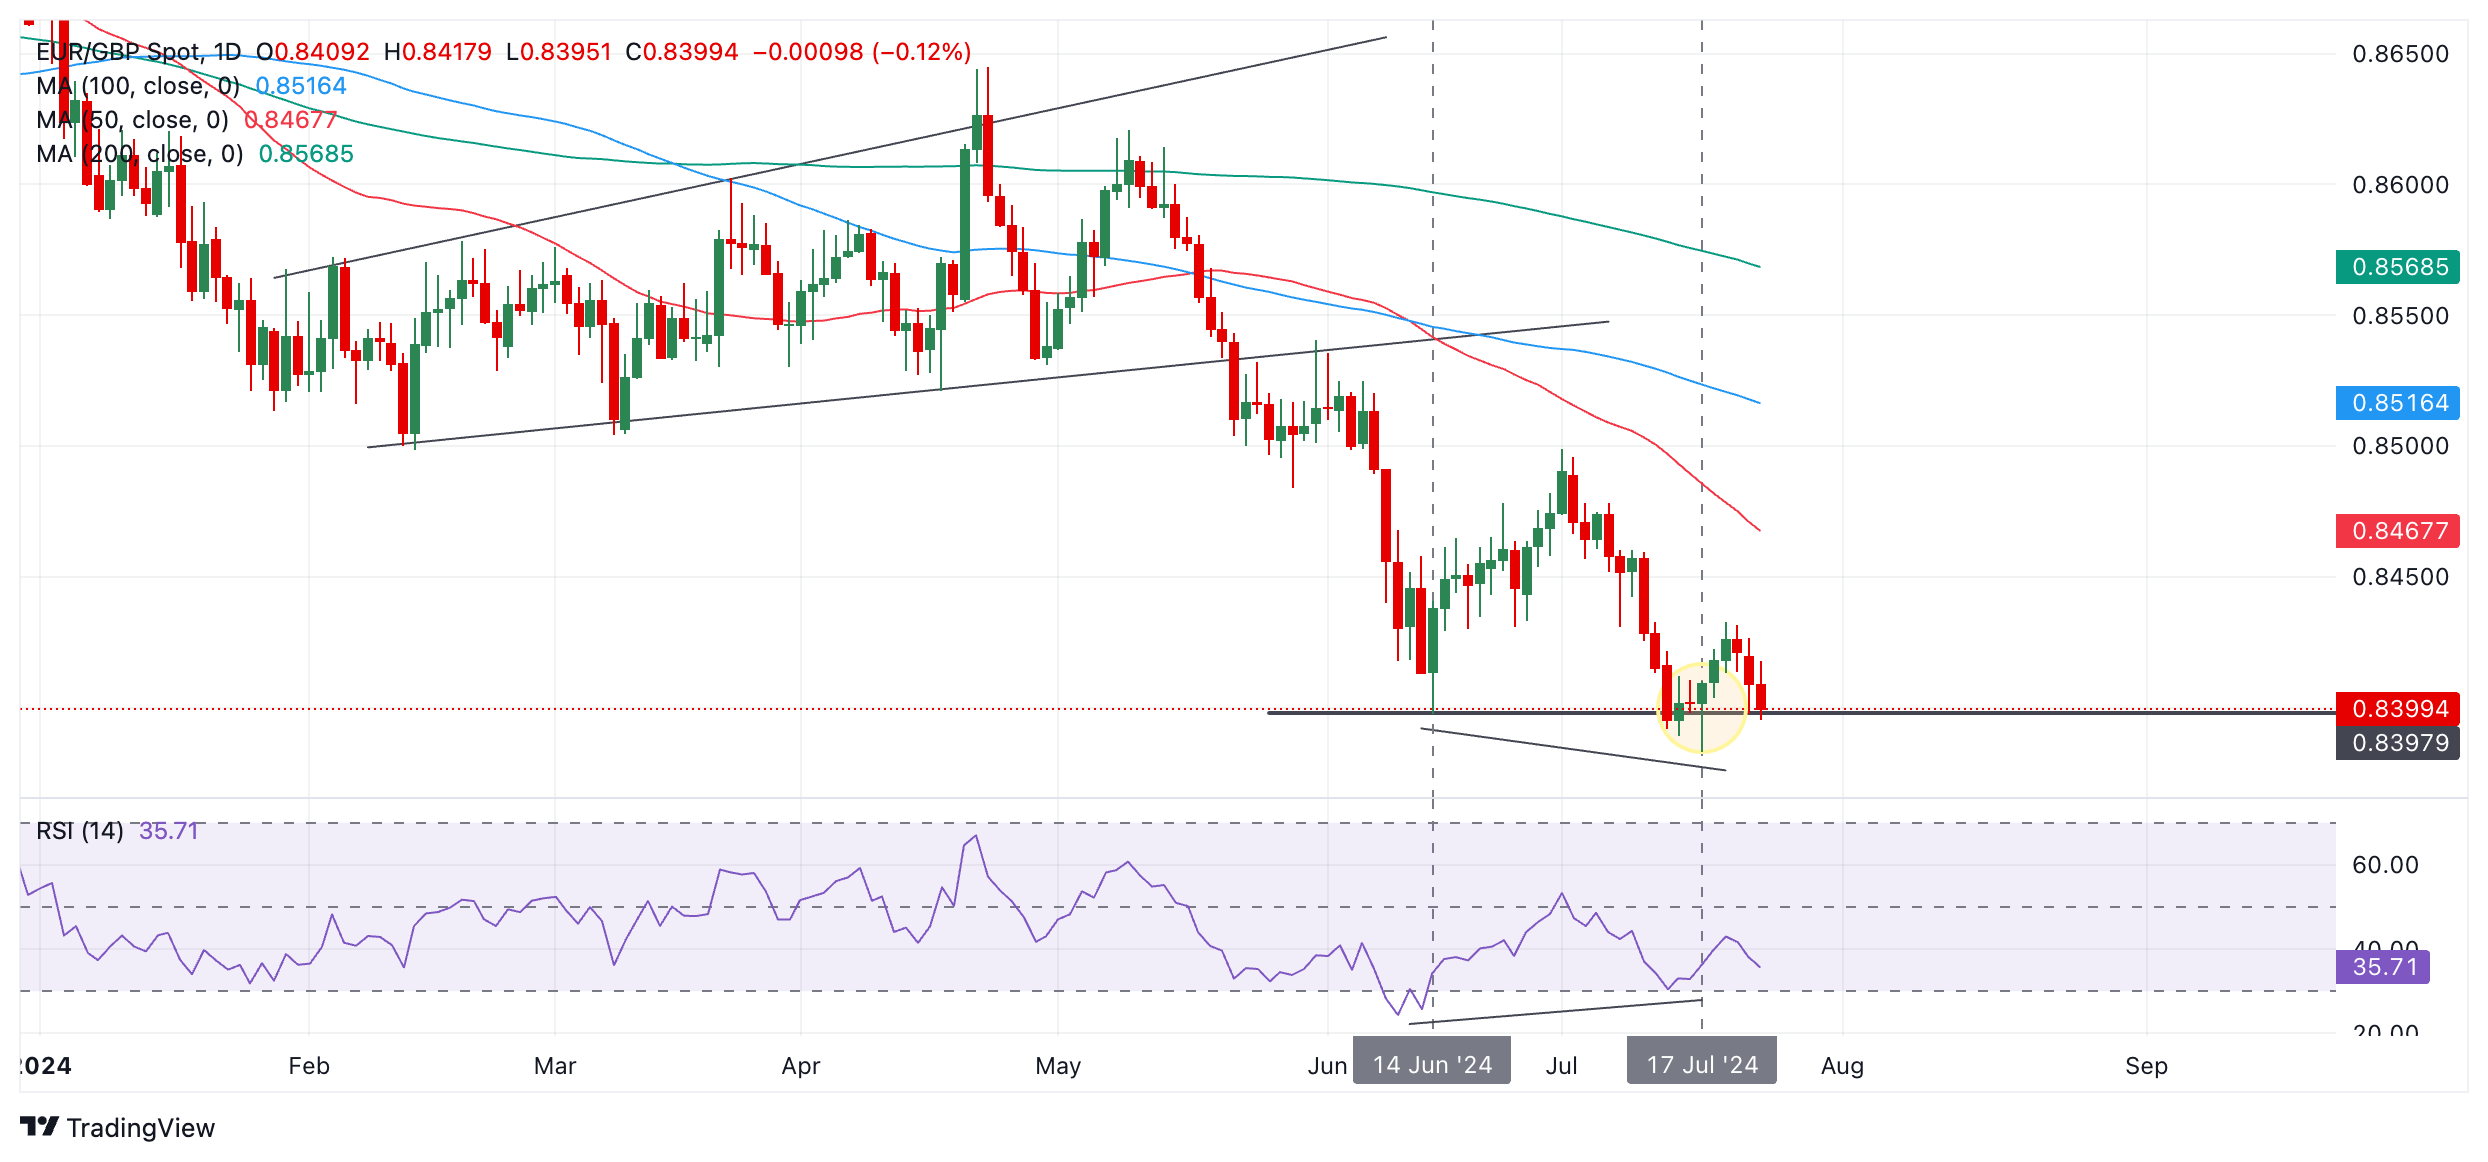
The June 14 low at 0.8398 will probably provide robust support and it is possible the pair could undergo a reversal using the level as a launchpad higher. However, there are only tentative secondary indications that this is happening. Price itself continues to fall, and price is the most important indicator.
That said, the pair formed a bullish Japanese Hammer candlestick pattern on July 17 and this was followed by a green up day further confirming the bullish pattern. Candlesticks, however, are more reliable as short-term signals.
EUR/GBP is converging bullishly with the Relative Strength Index (RSI) between the June 14 and July 17 lows. This is also a potentially bullish sign. This happens when price makes a new low, as it did in July, but the RSI does not also make a new low. This indicates a lack of bearish momentum, and can be an early warning sign of a reversal in the trend.
Despite these signs, the short and medium-term trends are still bearish which means broad downside pressure will probably persist, and the odds favor on balance more downside. A break below the lows of the Hammer candlestick at 0.8383 would usher in more weakness. The next target lower would probably be the round-number at 0.8350.
It would require a break above 0.8499 (July 1 high) to upend the downtrend and indicate the pair was in a more bullish environment.
Forex News
Keep up with the financial markets, know what's happening and what is affecting the markets with our latest market updates. Analyze market movers, trends and build your trading strategies accordingly.