
AUD/JPY Price Analysis: Bears extend control, but downside momentum weakens
- AUD/JPY moved lower ahead of the Asian session, extending its losing streak to two days and trading near the 93.00 area.
- Selling momentum appears to be fading, with technical indicators suggesting that bulls might attempt a rebound or initiate sideways movement.
The AUD/JPY pair experienced a second consecutive day of losses on Friday landing at around 93.30, as sellers maintained control and drove prices lower. Despite the bearish pressure, the downward momentum has shown signs of easing, hinting at a possible stabilization or even a near-term bounce.
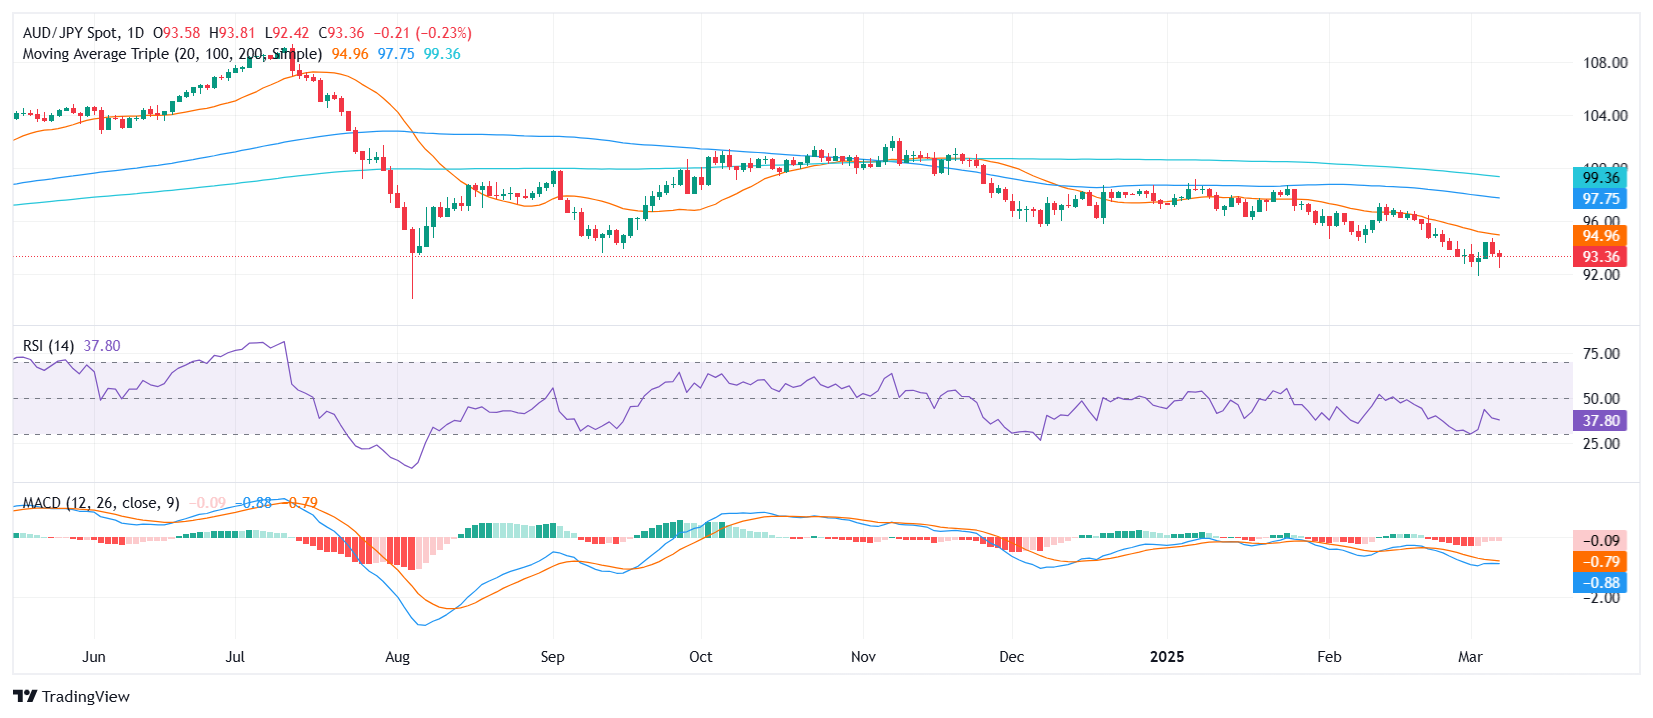
The Relative Strength Index (RSI) remains in negative territory but is only mildly declining, suggesting that selling pressure may not be as intense as previous sessions. Meanwhile, the Moving Average Convergence Divergence (MACD) continues to print decreasing red bars, indicating that downside momentum is losing steam. This technical setup could open the door for a potential recovery or at least a consolidation phase before the next directional move.
On the technical front, support is forming near the 92.80 zone, with a stronger floor at 92.50. The 20-day Simple Moving Average (SMA), located at 95.00, represents a major resistance point. A break above this level could shift the outlook in favor of buyers, while failure to regain ground may result in continued pressure toward the 92.00 handle.
AUD/JPY daily chart
AUD/JPY daily chart
Forex News
Keep up with the financial markets, know what's happening and what is affecting the markets with our latest market updates. Analyze market movers, trends and build your trading strategies accordingly.