GBP/JPY Price Analysis: Slumps below 192.00 amid risk-off mood
- GBP/JPY drops 0.56%, as rising Israel-Iran tensions drive safe-haven flows to the Yen.
- Though lower, the pair stays bullish above the Ichimoku Cloud, with recovery possible upon reclaiming 192.00.
- Watch key levels: Immediate support at the Kijun Sen at 191.06, with potential further drops towards 190.55.
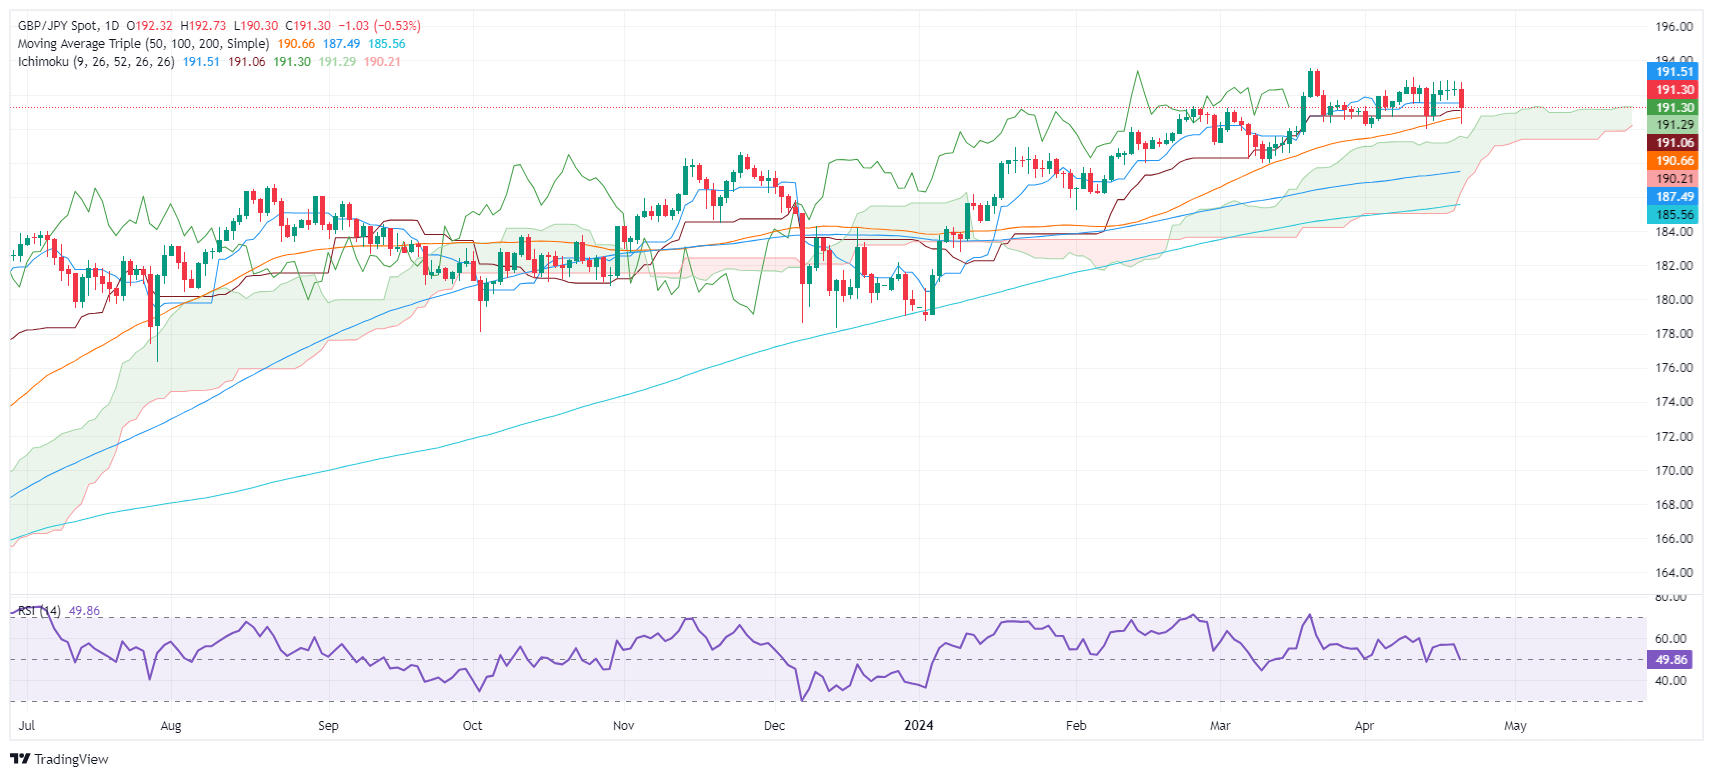
After consolidating around 192.00 for the last three days, the GBP/JPY finally tumbled to the 191.00 handle. A flight to safe-haven assets spurred by an escalation of the Israel-Iran conflict boosted the Japanese Yen (JPY) to the detriment of the Pound Sterling. At the time of writing, the cross has lost 0.56% and trades at 191.19.
GBP/JPY Price Analysis: Technical outlook
The GBP/JPY remains above the Ichimoku Cloud (Kumo), suggesting the pair is bullish. Despite sliding below key support levels, like the Tenkan and Kijun Sen, the 50-day moving average (DMA), and hitting a daily low of 190.29, the pair resumed its recovery to the current exchange rates.
For a bullish continuation, traders must reclaim 192.00 before breaking the next resistance area at 192.80. Once cleared that would expose the 193.00 psychological level, followed by the year-to-date (YTD) high at 193.54.
On the other hand, if the pair slips below the Kijun Sen level at 191.06, that would exacerbate a drop below the confluence of an upslope support trendline and the 50-day moving average (DMA) at 190.55.
GBP/JPY Price Action – Daily Chart
Forex News
Keep up with the financial markets, know what's happening and what is affecting the markets with our latest market updates. Analyze market movers, trends and build your trading strategies accordingly.