Gold price retains bullish bias; hits fresh all-time peak amid US-China trade war fears
- Gold price continues to attract safe-haven flows amid worries about Trump's trade tariffs.
- Fed rate cut bets undermine the USD and lend additional support to the XAU/USD pair.
- The risk-on environment warrants some caution for bulls amid a slightly overbought RSI.
Gold price (XAU/USD) builds on its steady intraday ascent through the first half of the European session on Wednesday and hits a fresh all-time peak, around the $2,862 region in the last hour. Investors continue to seek refuge in the traditional safe-haven bullion amid worries about the potential economic fallout from US President Donald Trump's trade tariffs. Apart from this, bets that the Federal Reserve (Fed) will keep cutting rates in the wake of slowing momentum in the US labor market lend additional support to the non-yielding yellow metal.
Meanwhile, the prospects for further policy easing by the Fed drag the US Dollar (USD) to a one-week low, which turn out to be another factor driving flows towards the Gold price. That said, Trump's decision to delay tariffs against Canada and Mexico remains supportive of the risk-on mood, which could cap gains for the XAU/USD amid slightly overbought conditions on the daily chart. This makes it prudent to wait for a near-term consolidation or a modest pullback before positioning for an extension of the recent upward trajectory. Traders now look forward to the release of the US ADP report on private-sector employment and the US ISM Services PMI for some impetus.
Gold price continues to draw support from trade war fears and follow-through USD selling
- China retaliated to US President Donald Trump's new duties and imposed targeted tariffs on US imports, fueling trade war fears between the world's top two economies and lifting the safe-haven Gold price to a fresh record high on Wednesday.
- The Job Openings and Labor Turnover Survey (JOLTS) published by the US Bureau of Labor Statistics on Tuesday showed that the number of job openings on the last business day of December stood at 7.6 million, down from 8.09 million previous.
- The data pointed to a slowdown in the job market, which could allow the Federal Reserve to cut rates further. This keeps the US Dollar bulls on the defensive near the weekly low and turns out to be another factor that benefits the XAU/USD pair.
- Trump offered concessions to Canada and Mexico by delaying the 25% trade tariffs for 30 days, fueling hopes that a global trade war could be averted, though it does little to dent the bullish sentiment around the safe-haven precious metal.
- Wednesday's US economic docket features the release of the ADP report on private-sector employment and ISM Services PMI. The data should influence the USD and produce short-term trading opportunities around the commodity.
- The focus, however, will remain on the closely-watched US monthly employment detail – popularly known as the Nonfarm Payrolls (NFP) report on Friday. Apart from this, tariff headlines should infuse volatility in the markets.
Gold price uptrend remains uniterrupted despite slightly overbought RSI on the daily chart
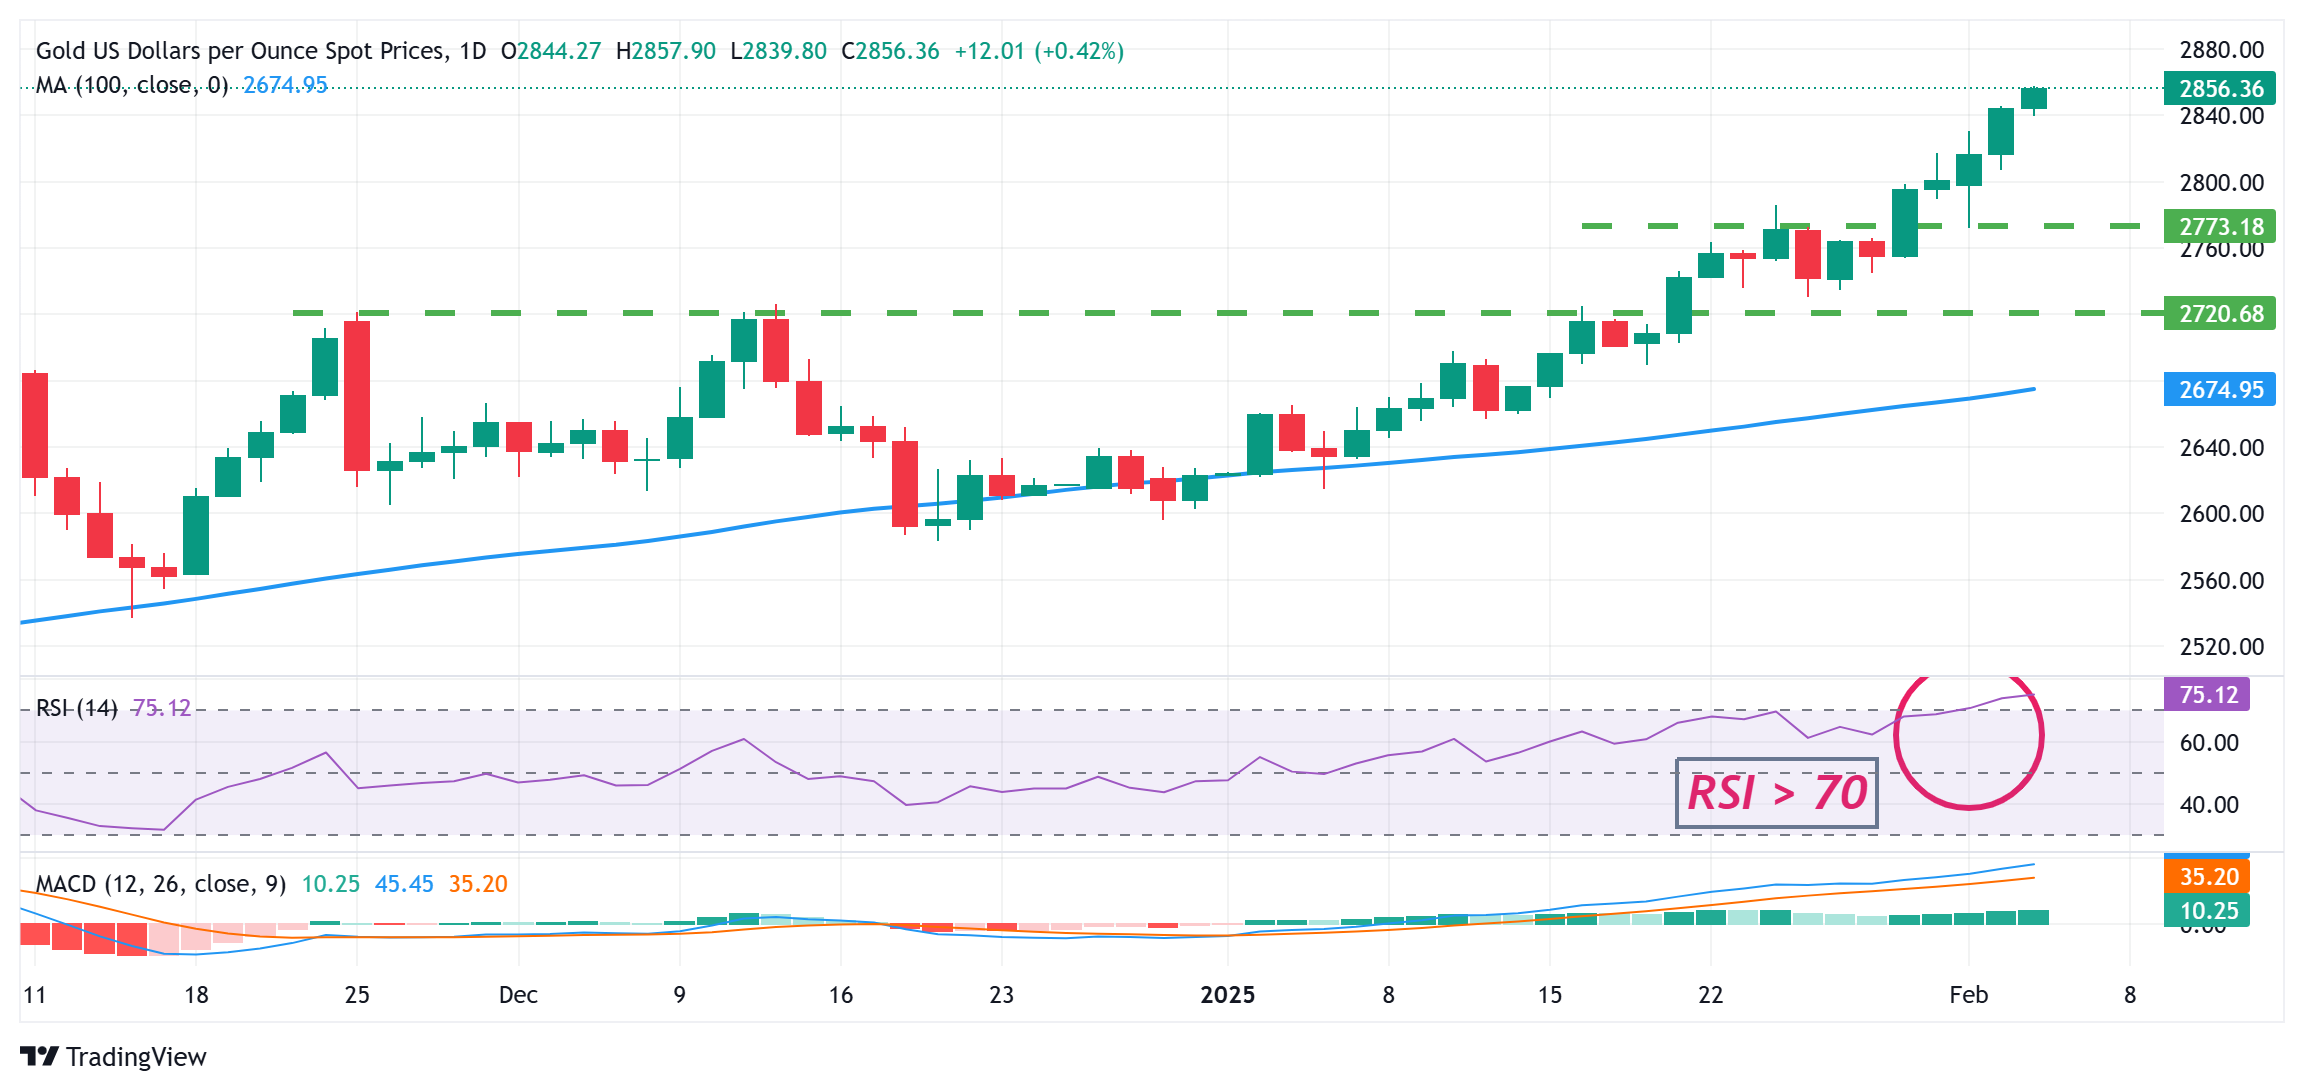
From a technical perspective, the Relative Strength Index (RSI) on hourly and daily charts is flashing slightly overbought conditions, warranting some caution for bullish traders. That said, the recent breakout momentum beyond the $2,800 mark suggests that the path of least resistance for the Gold price remains to the upside. This, in turn, supports prospects for an extension of the recent well-established uptrend from the December 2024 swing low.
In the meantime, any corrective slide now seems to find some support near the $2,830 area ahead of the $2,800 mark. A further decline could be seen as a buying opportunity and is more likely to remain limited near the $2,773-2,772 horizontal resistance breakpoint, now turned support. A convincing break below the latter, however, might prompt some technical selling and pave the way for deeper losses.
US Dollar PRICE Today
The table below shows the percentage change of US Dollar (USD) against listed major currencies today. US Dollar was the strongest against the Canadian Dollar.
| USD | EUR | GBP | JPY | CAD | AUD | NZD | CHF | |
|---|---|---|---|---|---|---|---|---|
| USD | -0.15% | -0.08% | -0.63% | -0.05% | -0.14% | -0.33% | -0.13% | |
| EUR | 0.15% | 0.07% | -0.46% | 0.11% | 0.01% | -0.18% | 0.02% | |
| GBP | 0.08% | -0.07% | -0.54% | 0.04% | -0.06% | -0.25% | -0.05% | |
| JPY | 0.63% | 0.46% | 0.54% | 0.58% | 0.49% | 0.28% | 0.49% | |
| CAD | 0.05% | -0.11% | -0.04% | -0.58% | -0.09% | -0.28% | -0.09% | |
| AUD | 0.14% | -0.01% | 0.06% | -0.49% | 0.09% | -0.19% | 0.00% | |
| NZD | 0.33% | 0.18% | 0.25% | -0.28% | 0.28% | 0.19% | 0.20% | |
| CHF | 0.13% | -0.02% | 0.05% | -0.49% | 0.09% | -0.00% | -0.20% |
The heat map shows percentage changes of major currencies against each other. The base currency is picked from the left column, while the quote currency is picked from the top row. For example, if you pick the US Dollar from the left column and move along the horizontal line to the Japanese Yen, the percentage change displayed in the box will represent USD (base)/JPY (quote).
US-China Trade War FAQs
Generally speaking, a trade war is an economic conflict between two or more countries due to extreme protectionism on one end. It implies the creation of trade barriers, such as tariffs, which result in counter-barriers, escalating import costs, and hence the cost of living.
An economic conflict between the United States (US) and China began early in 2018, when President Donald Trump set trade barriers on China, claiming unfair commercial practices and intellectual property theft from the Asian giant. China took retaliatory action, imposing tariffs on multiple US goods, such as automobiles and soybeans. Tensions escalated until the two countries signed the US-China Phase One trade deal in January 2020. The agreement required structural reforms and other changes to China’s economic and trade regime and pretended to restore stability and trust between the two nations. However, the Coronavirus pandemic took the focus out of the conflict. Yet, it is worth mentioning that President Joe Biden, who took office after Trump, kept tariffs in place and even added some additional levies.
The return of Donald Trump to the White House as the 47th US President has sparked a fresh wave of tensions between the two countries. During the 2024 election campaign, Trump pledged to impose 60% tariffs on China once he returned to office, which he did on January 20, 2025. With Trump back, the US-China trade war is meant to resume where it was left, with tit-for-tat policies affecting the global economic landscape amid disruptions in global supply chains, resulting in a reduction in spending, particularly investment, and directly feeding into the Consumer Price Index inflation.
Forex News
Keep up with the financial markets, know what's happening and what is affecting the markets with our latest market updates. Analyze market movers, trends and build your trading strategies accordingly.