EUR/JPY Price Analysis: Bulls make a stride and reclaim the 20-day SMA
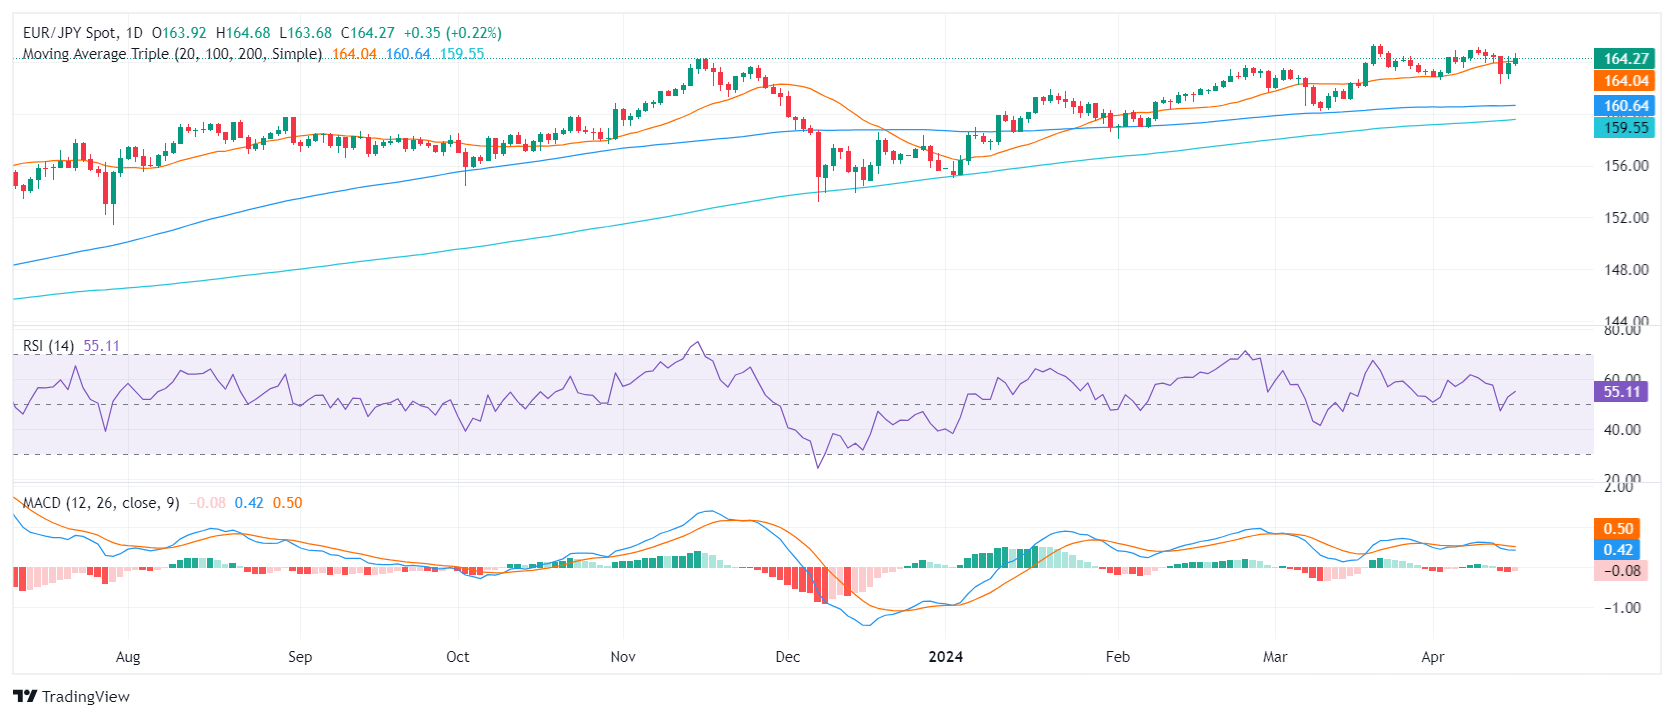
- The daily chart reveals that the EUR/JPY maintains a bullish sentiment, as indicated by the rising RSI and diminishing negative momentum via MACD.
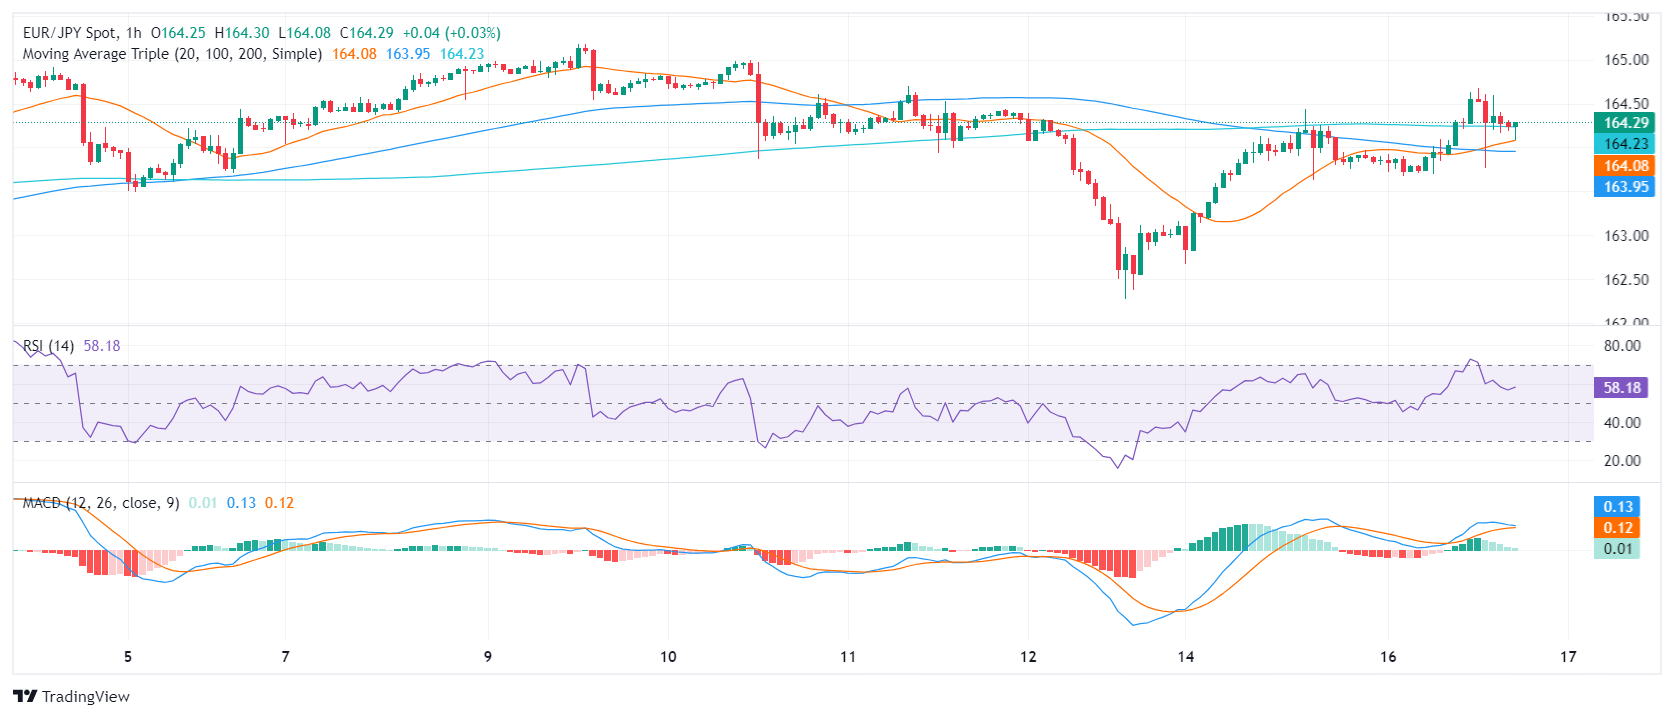
- The hourly chart's RSI shows that the pair is correcting overbought conditions.
The EUR/JPY pair is trading at 164.22, recording a slight uptick on Tuesday’s session. This slight appreciation points towards a continuing strength of the Euro against the Japanese Yen. Despite minor market fluctuations suggesting temporary corrections, the broader technical outlook remains largely bullish. To reinforce this, bulls stepped in and recovered the 20-day Simple Moving Average (SMA) which brightened the outlook for the buyers.
The daily chart reveals that the EUR/JPY pair maintains a bullish momentum, indicated by its Relative Strength Index (RSI) standing at 55, comfortably within the positive trend zone. This is supported by the falling red bars of the Moving Average Convergence Divergence (MACD) histogram, which demonstrates diminishing negative momentum.
EUR/JPY daily chart
Moving to the hourly chart, recent RSI readings oscillate between 71 and 54, suggesting the buyers are taking a quick breather. In addition, the relatively flat green bars of the hourly MACD indicate a nearly stagnant positive momentum.
EUR/JPY hourly chart
The broader outlook of the EUR/JPY based on its position relative to the Simple Moving Average (SMA) provides more insight. The EUR/JPY jump above the 20-day SMA today may signal a sharp short-term uptick, suggesting buy opportunities for traders. Moreover, its position above both the 100-day and 200-day SMA confirms a long-term bullish trend, implying that the Euro retains its strength against the Japanese Yen.
Forex News
Keep up with the financial markets, know what's happening and what is affecting the markets with our latest market updates. Analyze market movers, trends and build your trading strategies accordingly.