GBP/JPY Price Analysis: Stalls within a tight range around 192.00
- GBP/JPY remains confined between 191.60 and 192.80, unable to break through key resistance at 193.00.
- Technical analysis highlights potential decline towards strong support at 190.00, with key indicators aligning.
- Immediate technical supports to watch include the Tenkan-Sen at 191.46 and the Kijun-Sen at 191.06.
The GBP/JPY consolidates at around current exchange rates, unable to break above/below the 191.60/192.80 range, following an inflation report in the UK that sparked a rally in the GBP/USD pair. Therefore, after finishing Wednesday's session around familiar levels, the cross-currency pair trades at 192.22, virtually unchanged.
GBP/JPY Price Analysis: Technical outlook
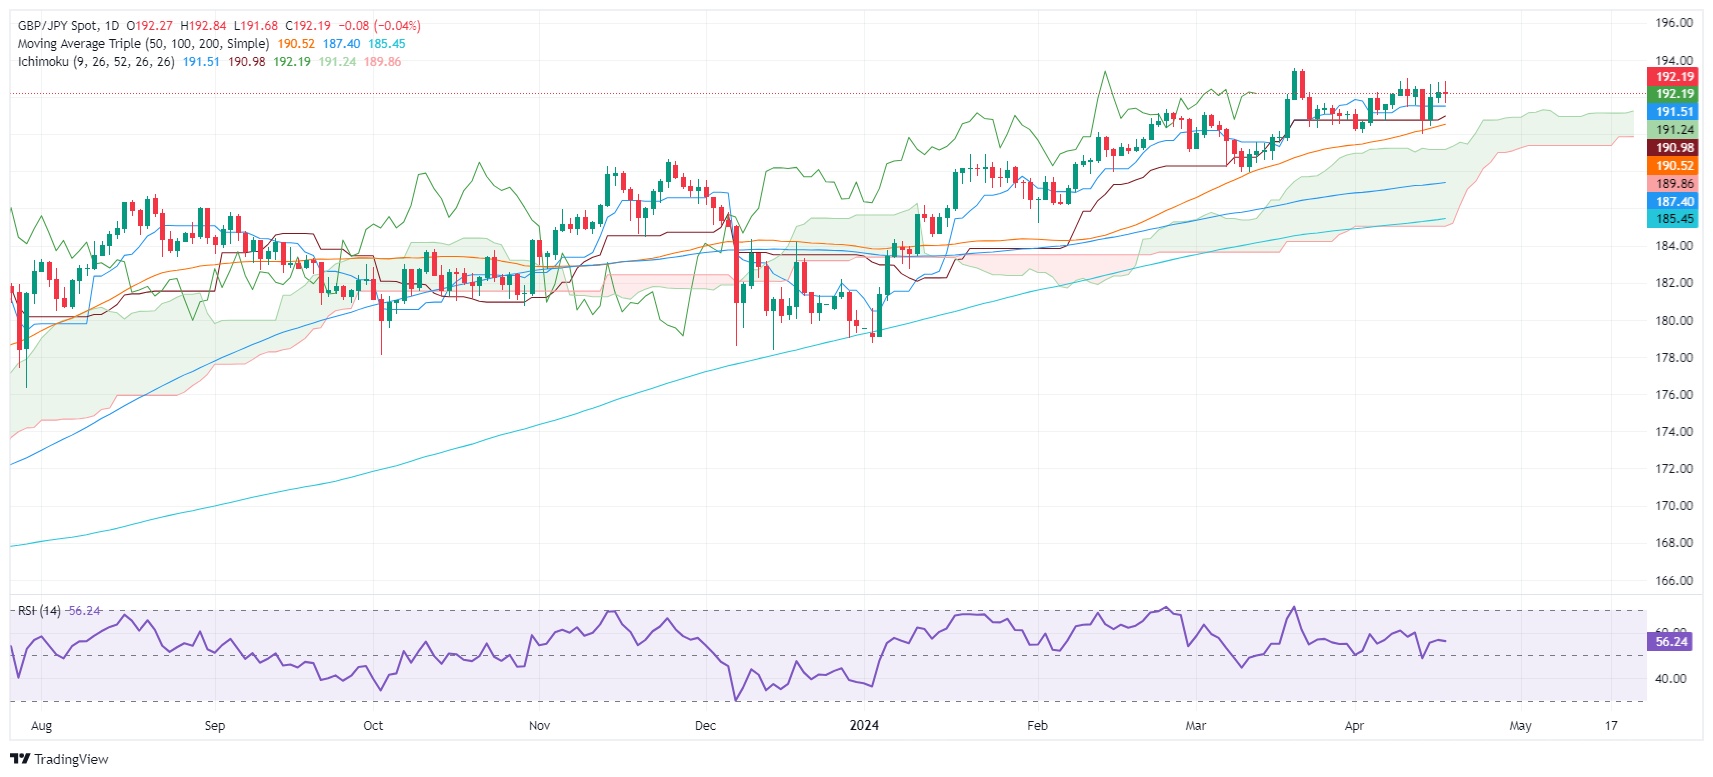
The daily chart shows the pair has peaked, as buyers remained unable to crack the 193.00 figure to challenge the year-to-date (YTD) high of 193.53. That opened the door for a dip toward the 190.00 mark, a strong support level, as key technical indicators converged around that area. The April 2 low of 190.03, the 50-day moving average (DMA), and the top of the Ichimoku Cloud (Kumo).
Since then, the GBP/JPY remains subdued. The first resistance would be 193.00, followed by the YTD high. On the flip side, the first support would be 190.00, followed by key support levels. Up next would be the Tenkan-Sen at 191.46, the Senkou Span A at 191.26, and the Kijun-Sen at 191.06.
GBP/JPY Price Action – Daily Chart
Forex News
Keep up with the financial markets, know what's happening and what is affecting the markets with our latest market updates. Analyze market movers, trends and build your trading strategies accordingly.