
NZD/USD Price Analysis: Pair extends decline, hits lowest level since mid-February
- NZD/USD continues to slide, marking its fifth consecutive daily loss with sharp downside pressure.
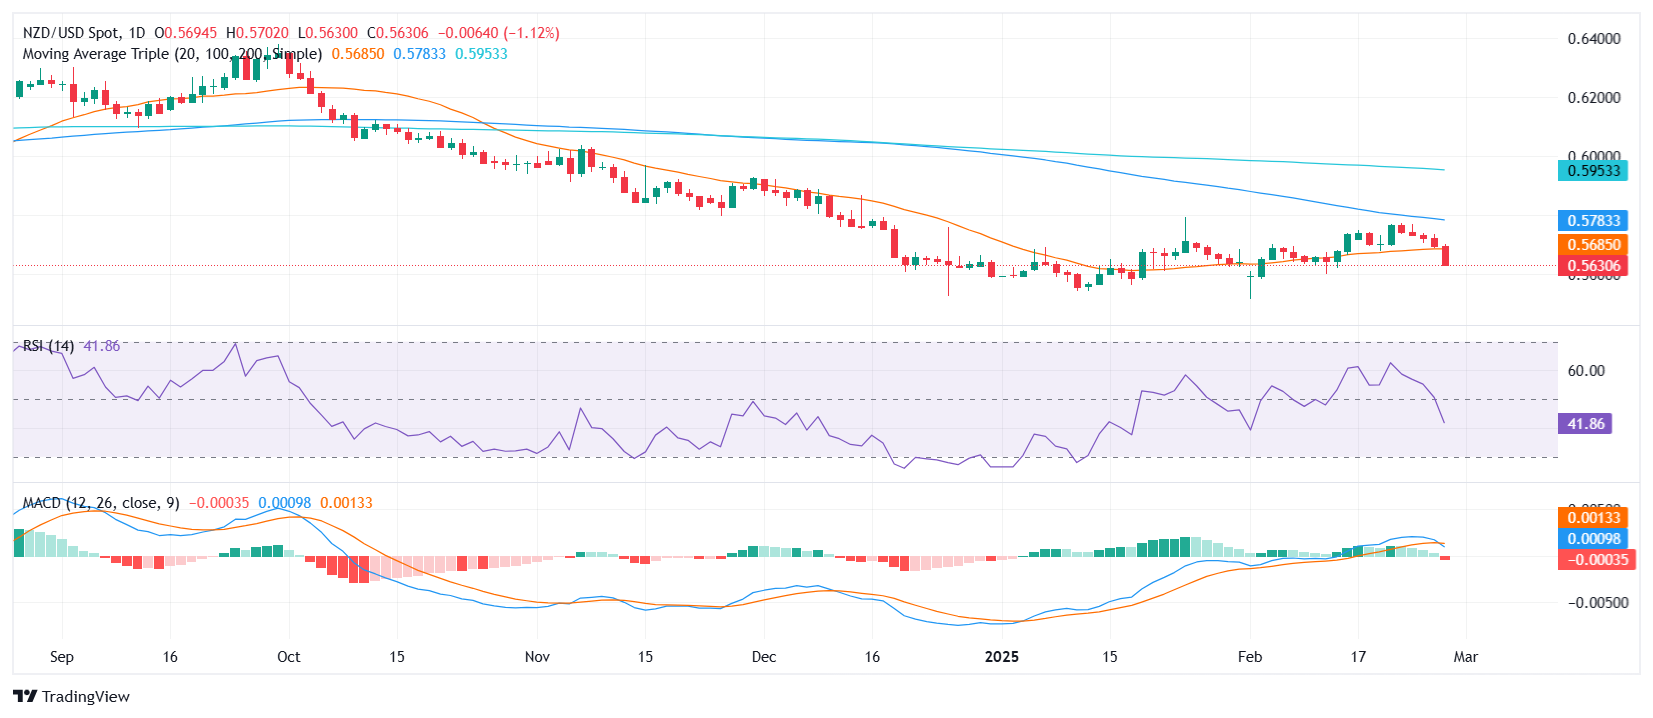
- The pair loses the 20-day SMA while the MACD crosses below its signal line, reinforcing the bearish outlook.
- Key support lies at 0.5600, while resistance is seen at 0.5680 and the 20-day SMA.
NZD/USD extended its downward momentum on Thursday, registering a fifth straight session of losses and hitting its lowest level since mid-February. The selling pressure intensified after the pair failed to hold above the 20-day Simple Moving Average (SMA) and plunging towards 0.5630, signaling a deeper correction. Bears remain in control, pushing the price further into negative territory.
Technical indicators reflect the growing bearish momentum. The Relative Strength Index (RSI) is firmly in negative territory and declining, suggesting that sellers maintain the upper hand. Additionally, the Moving Average Convergence Divergence (MACD) has crossed below its signal line, a sign that downside momentum is strengthening. The histogram prints flat green bars, indicating a temporary pause in momentum but not a shift in trend.
Looking ahead, immediate support is located at 0.5600, a level that could act as a short-term floor. A decisive break below this could open the door toward 0.5550. On the upside, the first resistance is at 0.5680, aligning with the recent intraday peaks, followed by the 20-day SMA, which needs to be reclaimed for the pair to regain bullish traction.
NZD/USD daily chart
Forex News
Keep up with the financial markets, know what's happening and what is affecting the markets with our latest market updates. Analyze market movers, trends and build your trading strategies accordingly.