Pound Sterling gains as traders bet slower BoE monetary easing cycle
- The Pound Sterling moves higher as traders expect the BoE to cut interest rates two times more this year.
- US S&P Global Services PMI contracted for the first time in 25 months.
- This week, investors will focus on the US Durable Goods and PCE inflation data for January.
The Pound Sterling (GBP) gains against its peers as investors expect the Bank of England (BoE) to follow a moderate policy-easing cycle this year. Upbeat United Kingdom (UK) Retail Sales, hotter-than-expected Consumer Price Index (CPI) data for January, and strong wage growth momentum in three months ending December have forced traders to pare BoE dovish bets.
Traders expect the BoE to cut interest rates two more times this year, according to money market expectations. The BoE also reduced its key borrowing rates by 25 basis points (bps) to 4.5% in the policy meeting earlier this month.
Contrary to market expectations, analysts at TD Securities expect the BoE to cut interest rates four times more this year amid uncertainty over potential tariffs from a second Trump presidency. However, the agency has revised its forecast for the next interest rate cut to May from March due to recent stronger-than-expected UK economic data.
Going forward, speeches from BoE policymakers will influence the British currency. Clare Lombardelli, Swati Dhingra, and Deputy Governor Dave Ramsden are set to speak on Monday, and they could provide fresh cues about the monetary policy outlook.
On the economic data front, flash S&P Global/CIPS PMI data for February has come in line with estimates. The Composite PMI expanded at a slower pace to 50.5 from 50.6 in January. Activities in the manufacturing and services sectors contracted and expanded, respectively, at a surprisingly faster pace.
British Pound PRICE Today
The table below shows the percentage change of British Pound (GBP) against listed major currencies today. British Pound was the strongest against the Japanese Yen.
| USD | EUR | GBP | JPY | CAD | AUD | NZD | CHF | |
|---|---|---|---|---|---|---|---|---|
| USD | -0.07% | -0.07% | 0.33% | -0.06% | -0.15% | -0.04% | 0.16% | |
| EUR | 0.07% | -0.08% | 0.24% | -0.17% | -0.09% | -0.15% | 0.06% | |
| GBP | 0.07% | 0.08% | 0.36% | -0.09% | -0.00% | -0.07% | 0.14% | |
| JPY | -0.33% | -0.24% | -0.36% | -0.36% | -0.39% | -0.29% | -0.07% | |
| CAD | 0.06% | 0.17% | 0.09% | 0.36% | -0.15% | 0.01% | 0.23% | |
| AUD | 0.15% | 0.09% | 0.00% | 0.39% | 0.15% | -0.07% | 0.15% | |
| NZD | 0.04% | 0.15% | 0.07% | 0.29% | -0.01% | 0.07% | 0.22% | |
| CHF | -0.16% | -0.06% | -0.14% | 0.07% | -0.23% | -0.15% | -0.22% |
The heat map shows percentage changes of major currencies against each other. The base currency is picked from the left column, while the quote currency is picked from the top row. For example, if you pick the British Pound from the left column and move along the horizontal line to the US Dollar, the percentage change displayed in the box will represent GBP (base)/USD (quote).
Daily digest market movers: Pound Sterling gives up some gains against USD as investors digest weak US Services PMI
- The Pound Sterling surrenders some of its intraday gains after facing resistance near 1.2700 against the US Dollar (USD) in European trading hours on Monday. The GBP/USD pair falls from the intraday high as the US Dollar bounces back. The US Dollar Index (DXY), which tracks the Greenback’s value against six major currencies, recovers to near 106.50 after sliding to near the 12-week low of 106.10.
- Earlier in the day, the US Dollar fell sharply due to weak United States (US) services sector activity data, which increased bets for an interest rate cut by the Federal Reserve (Fed) in June. The US Dollar Index (DXY), which tracks the Greenback’s value against six major currencies, declines to near 106.10, the lowest level in almost 12 weeks.
- On Friday, the US preliminary S&P Global Purchasing Managers Index (PMI) report showed a significant slowdown in business activity in February. The Composite PMI rose at a slower pace to 50.4 from 52.7 in January as activities in the services sector declined unexpectedly. The Services PMI contracted to 49.7 from 52.9, falling below the 50 threshold for the first time in 25 months. Economists expected the service sector activity to have expanded at a slightly faster pace to 53.0.
- Service providers commonly linked the downturn in activity and worsening new orders growth to political uncertainty, notably in relation to federal spending cuts and potential policy impacts on economic growth and inflation outlooks, according to the S&P Global PMI report.
- According to the CME FedWatch tool, the probability of the Fed’s interest rates remaining unchanged at the current range of 4.25%- 4.50% is 41.1%, down from nearly 50% before the PMI release.
- On the contrary, the Manufacturing PMI expanded faster than expected to 51.6 in February from estimates of 51.5 and the former reading of 51.2.
- The business activity data indicates the positive impact of US President Donald Trump’s tariff agenda on the country’s manufacturing sector. Trump had already mentioned in his comments that tariffs on imports would boost production activities locally, fulfilling his agenda of making “America great again”.
- This week, investors will focus on the US Durable Goods Orders and the Personal Consumption Expenditures Price Index (PCE) data for January, which will be released on Thursday and Friday, respectively.
Technical Analysis: Pound Sterling struggles around 200-day EMA
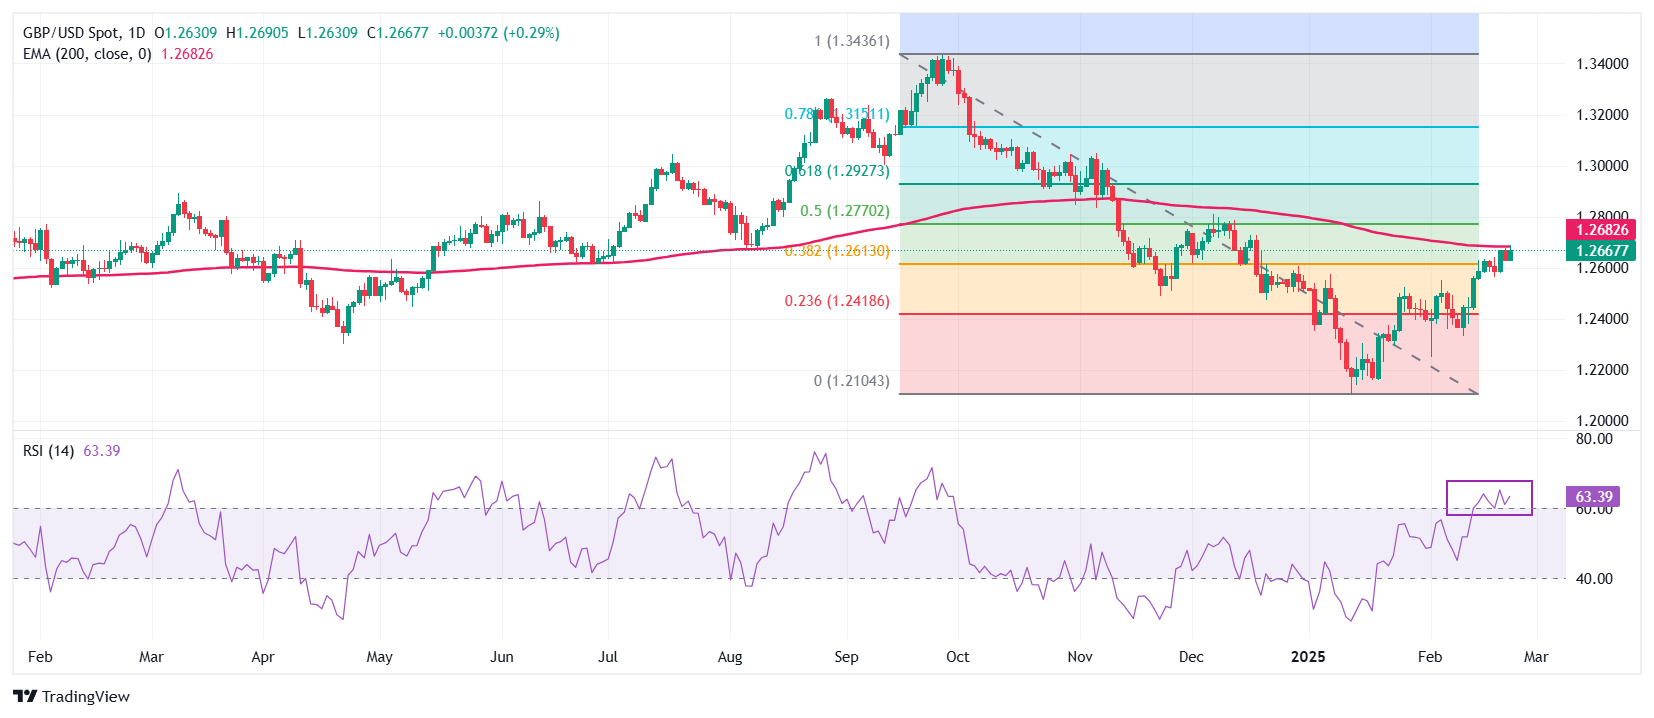
The Pound Sterling struggles to extend its upside to near the 200-day Exponential Moving Average (EMA), which stands around 1.2680, against the US Dollar in Monday’s European session. The GBP/USD pair strengthened after breaking above the 38.2% Fibonacci retracement from the end-September high to the mid-January low downtrend around 1.2620.
The 14-day Relative Strength Index (RSI) holds above 60.00. The bullish momentum would strengthen if the RSI (14) sustains above that level.
Looking down, the February 11 low of 1.2333 will act as a key support zone for the pair. On the upside, the 50% and 61.8% Fibonacci retracement at 1.2770 and 1.2927, respectively, will act as key resistance zones.
Economic Indicator
S&P Global Services PMI
The S&P Global Services Purchasing Managers Index (PMI), released on a monthly basis, is a leading indicator gauging business activity in the US services sector. As the services sector dominates a large part of the economy, the Services PMI is an important indicator gauging the state of overall economic conditions. The data is derived from surveys of senior executives at private-sector companies from the services sector. Survey responses reflect the change, if any, in the current month compared to the previous month and can anticipate changing trends in official data series such as Gross Domestic Product (GDP), industrial production, employment and inflation. A reading above 50 indicates that the services economy is generally expanding, a bullish sign for the US Dollar (USD). Meanwhile, a reading below 50 signals that activity among service providers is generally declining, which is seen as bearish for USD.
Read more.Last release: Fri Feb 21, 2025 14:45 (Prel)
Frequency: Monthly
Actual: 49.7
Consensus: 53
Previous: 52.9
Source: S&P Global
Forex News
Keep up with the financial markets, know what's happening and what is affecting the markets with our latest market updates. Analyze market movers, trends and build your trading strategies accordingly.