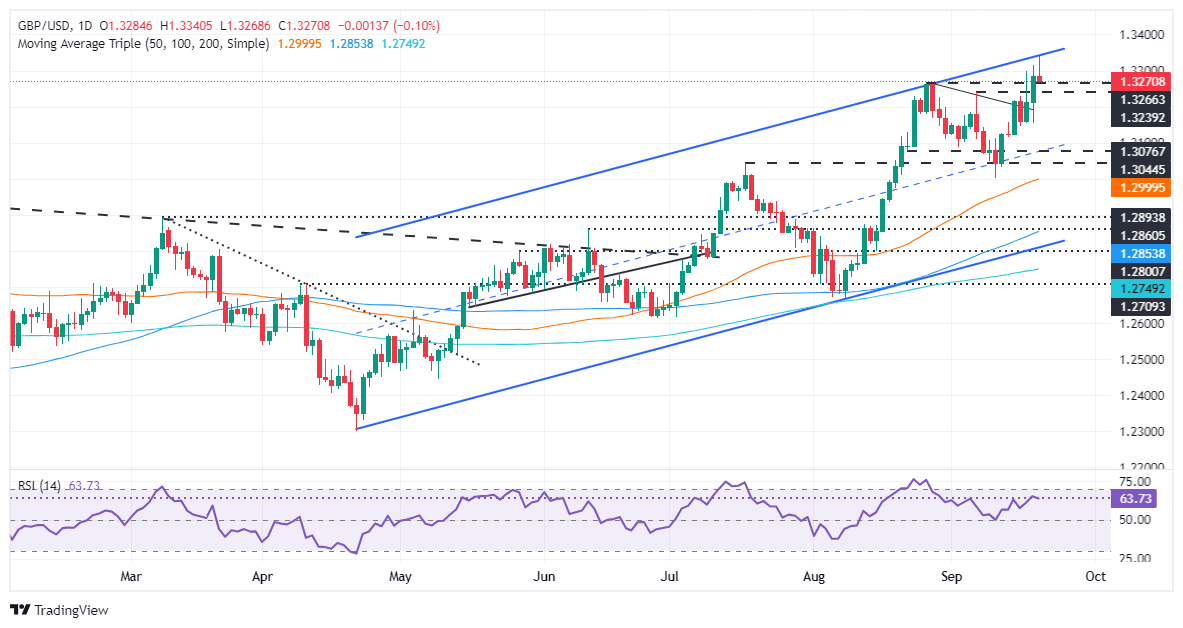
GBP/USD Price Forecast: Gains modestly after hitting record high above 1.3300
- GBP/USD hits resistance at 1.3340 and forms a potential ‘shooting star’ candlestick, signaling possible further losses.
- Key support lies at 1.3250, with additional levels at 1.3239, 1.3200, and the July 14 peak at 1.3142.
- On the upside, GBP/USD must reclaim 1.3300 to retest the YTD high of 1.3340, with further resistance at 1.3437.
The Pound Sterling registered minimal gains versus the US Dollar during the North American session after reaching a two-and-a-half-year high of 1.3340 on an upbeat retail sales report in the UK. At the time of writing, the GBP/USD trades at 1.3282, a gain of 0.03%.
GBP/USD Price Forecast: Technical outlook
From a technical standpoint, the GBP/USD clashed with solid resistance as the pair reached the top of an ascending channel shy of testing 1.3350. Since then, the pair erased those gains, about to form a ‘shooting star’ candle, which opens the door for further losses.
Momentum remains bullish according to the Relative Strength Index (RSI). However, a negative divergence looms, which could spur a pullback in the pair.
If GBP/USD tumbles below 1.3250, further downside is seen. Once cleared, the next stop would be the September 6 peak at 1.3239, ahead of 1.3200. If surpassed, key support levels will be exposed, like the July 14, 2023, peak at 1.3142, followed by the September 11 low of 1.3001.
Conversely, if GBP/USD reclaims 1.3300, the first resistance would be the year-to-date (YTD) high of 1.3340 ahead of the March 1, 2022, pivot high at 1.3437.
GBP/USD Price Action – Daily Chart
British Pound PRICE Today
The table below shows the percentage change of British Pound (GBP) against listed major currencies today. British Pound was the strongest against the Japanese Yen.
| USD | EUR | GBP | JPY | CAD | AUD | NZD | CHF | |
|---|---|---|---|---|---|---|---|---|
| USD | 0.20% | 0.10% | 1.21% | 0.19% | 0.45% | 0.40% | 0.39% | |
| EUR | -0.20% | -0.11% | 1.05% | -0.03% | 0.23% | 0.21% | 0.20% | |
| GBP | -0.10% | 0.11% | 1.15% | 0.10% | 0.36% | 0.33% | 0.32% | |
| JPY | -1.21% | -1.05% | -1.15% | -1.01% | -0.77% | -0.81% | -0.80% | |
| CAD | -0.19% | 0.03% | -0.10% | 1.01% | 0.25% | 0.22% | 0.22% | |
| AUD | -0.45% | -0.23% | -0.36% | 0.77% | -0.25% | -0.01% | -0.02% | |
| NZD | -0.40% | -0.21% | -0.33% | 0.81% | -0.22% | 0.01% | -0.00% | |
| CHF | -0.39% | -0.20% | -0.32% | 0.80% | -0.22% | 0.02% | 0.00% |
The heat map shows percentage changes of major currencies against each other. The base currency is picked from the left column, while the quote currency is picked from the top row. For example, if you pick the British Pound from the left column and move along the horizontal line to the US Dollar, the percentage change displayed in the box will represent GBP (base)/USD (quote).
Forex News
Keep up with the financial markets, know what's happening and what is affecting the markets with our latest market updates. Analyze market movers, trends and build your trading strategies accordingly.