
Pound Sterling strengthens against US Dollar as US ADP Employment misses estimates
- The Pound Sterling rises ahead of BoE Andrew Bailey’s testimony before Parliament's Treasury Committee.
- Investors worry that US President Trump’s tariff agenda could weigh on the US economic growth.
- Bloating Fed dovish bets have weighed on the US Dollar.
The Pound Sterling (GBP) jumps to near 1.2850 against the US Dollar (USD) in North American trading hours on Wednesday, the highest level seen since November 12. The GBP/USD pair extends its winning streak for the third trading day due to continuous underperformance from the US Dollar. The US Dollar Index (DXY), which tracks the Greenback’s value against six major currencies, slumps to near 105.00.
The US Dollar weakens as it loses its risk premium stemming from US President Trump’s tariff agenda. On Tuesday, 25% tariffs on Canada and Mexico, and an additional 10% on China came into effect for pouring drugs into the US economy.
Market experts believe Trump’s tariffs could weaken households' overall spending, assuming that higher levies will be borne by US importers, who would pass on to end consumers. Such a scenario would diminish the purchasing power of individuals, forcing them to cut spending significantly.
Meanwhile, soft US ADP Employment Change has weighed further on the US Dollar. The ADP reported that private employers added 77K fresh workers, lower than estimates of 140K and the former release of 186K. Soft labor demand in the US private sector is expected to prompt Federal Reserve (Fed) dovish bets, which have already escalated lately. Fed dovish bets have swelled after a slew of weak US economic data. According to the CME FedWatch tool, the likelihood for the Fed to reduce interest rates in June has increased to 86% from 70% recorded a week ago.
For more cues on the current status of employment, investors will focus on the US Nonfarm Payrolls (NFP) data for February, which will be released on Friday.
Daily digest market movers: Pound Sterling trades higher ahead of BoE Bailey’s testimony
- The Pound Sterling trades higher against its major peers on Wednesday ahead of Bank of England (BoE) Governor Andrew Bailey’s testimony before Parliament's Treasury Committee scheduled at 14:30 GMT. Investors will pay close attention to Bailey’s testimony to get cues about the BoE’s monetary policy outlook.
- In February’s policy meeting, the BoE reduced its borrowing rates by 25 basis points (bps) to 4.5% but guided a ‘cautious and gradual’ interest rate cut approach. The BoE warned that inflationary pressures could accelerate in the third quarter of the year due to higher energy prices before returning to the 2% path.
- Traders expect the BoE to follow a moderate policy-easing cycle amid fears of inflationary pressures remaining persistently higher and see the central bank cutting interest rates two times more this year. Fears of elevated price pressures are based on the assumption that business owners will pass on the impact of higher employment cost in the face of an increase in employers’ contribution to National Insurance (NI) announced by Chancellor of the Exchequer Rachel Reeves in the Autumn Budget.
- On the global front, market participants expect a nominal impact of United States (US) President Donald Trump’s tariffs on the United Kingdom (UK) economy, given that Britain has a trade surplus against the US. Also, after meeting with UK Prime Minister Keir Starmer last week, Trump said that a trade deal could be made "pretty quickly" where tariffs “wouldn't be necessary".
Technical Analysis: Pound Sterling stabilizes above 200-day EMA
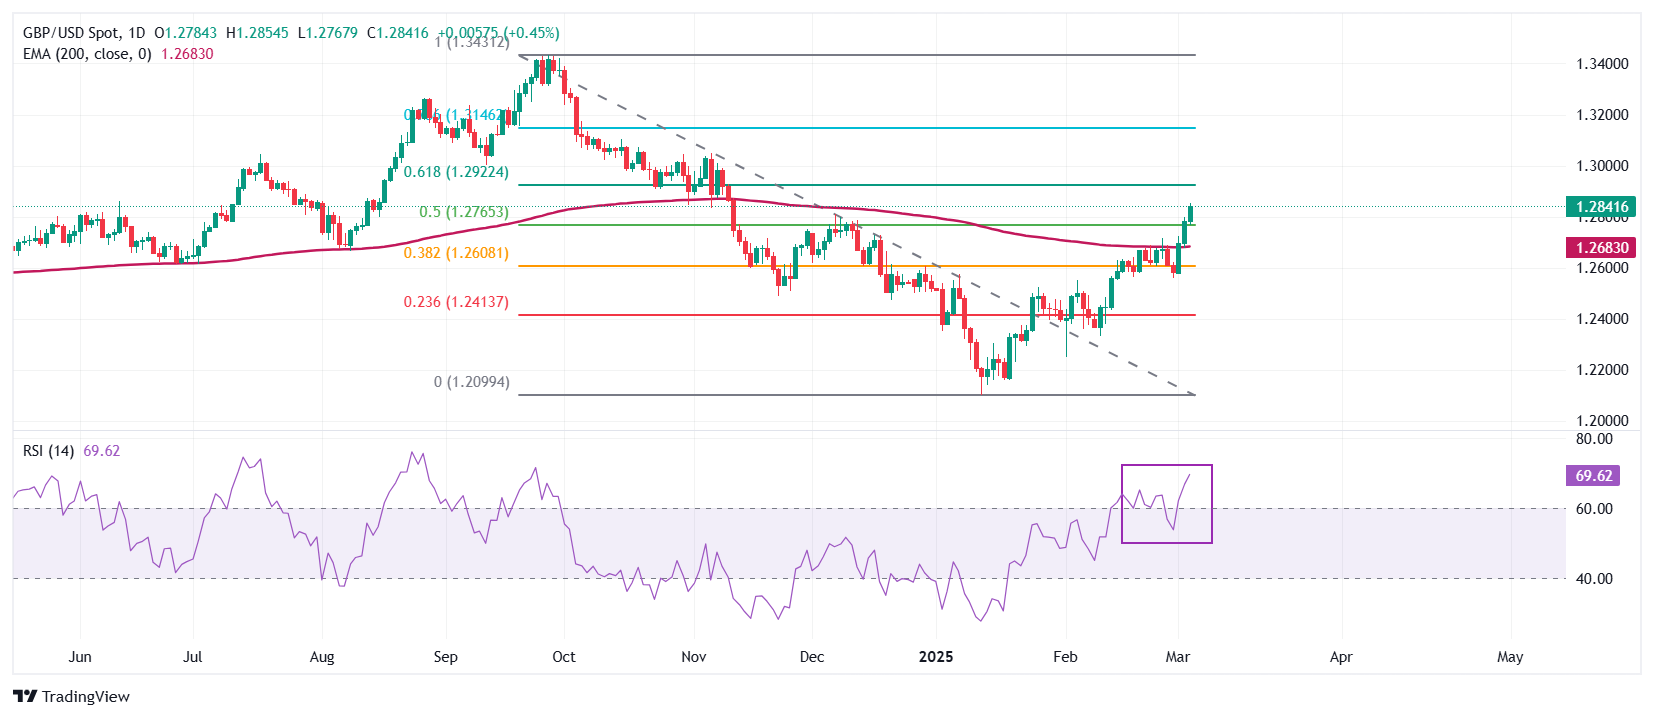
The Pound Sterling breaks above the 50% Fibonacci retracement level plotted from the late September high to mid-January low, around 1.2770. The long-term outlook of the GBP/USD pair has turned bullish as it sustains above the 200-day Exponential Moving Average (EMA), which is around 1.2680.
The 14-day Relative Strength Index (RSI) climbs above 60.00. A fresh bullish momentum would come into action if the RSI sustains above that level.
Looking down, the 38.2% Fibo retracement at 1.2608 will act as a key support zone for the pair. On the upside, the psychological 1.3000 level will act as a key resistance zone.
Economic Indicator
ADP Employment Change
The ADP Employment Change is a gauge of employment in the private sector released by the largest payroll processor in the US, Automatic Data Processing Inc. It measures the change in the number of people privately employed in the US. Generally speaking, a rise in the indicator has positive implications for consumer spending and is stimulative of economic growth. So a high reading is traditionally seen as bullish for the US Dollar (USD), while a low reading is seen as bearish.
Read more.Last release: Wed Mar 05, 2025 13:15
Frequency: Monthly
Actual: 77K
Consensus: 140K
Previous: 183K
Source: ADP Research Institute
Traders often consider employment figures from ADP, America’s largest payrolls provider, report as the harbinger of the Bureau of Labor Statistics release on Nonfarm Payrolls (usually published two days later), because of the correlation between the two. The overlaying of both series is quite high, but on individual months, the discrepancy can be substantial. Another reason FX traders follow this report is the same as with the NFP – a persistent vigorous growth in employment figures increases inflationary pressures, and with it, the likelihood that the Fed will raise interest rates. Actual figures beating consensus tend to be USD bullish.
Forex News
Keep up with the financial markets, know what's happening and what is affecting the markets with our latest market updates. Analyze market movers, trends and build your trading strategies accordingly.