
Japanese Yen surrenders intraday gains against USD; bullish potential seems intact
- The Japanese Yen attracts safe-haven flows amid trade war fears and risk-off mood.
- A downward revision of Japan’s Q4 GDP does little to dent the JPY bullish sentiment.
- The divergent BoJ-Fed expectations support prospects for a further USD/JPY decline.
The Japanese Yen (JPY) retreats slightly after touching the highest level since October against its American counterpart earlier this Tuesday, though the downside remains cushioned amid hawkish Bank of Japan (BoJ) expectations. Investors seem convinced that the BoJ will hike interest rates further amid broadening inflation in Japan, which has been a key factor behind the recent sharp narrowing of the yield differential between Japan and other countries. This, to a larger extent, offsets the downward revision of Japan's Q4 GDP print and should continue to act as a tailwind for the JPY.
Apart from this, the prevalent risk-off mood – as depicted by a generally weaker tone across the global equity markets – should contribute to limiting losses for the safe-haven JPY. The US Dollar (USD), on the other hand, languishes near a multi-month low amid expectations that a tariff-driven slowdown in US growth might force the Federal Reserve (Fed) to cut interest rates multiple times this year. This, in turn, should cap the USD/JPY pair's intraday recovery from the vicinity of mid-146.00s as traders keenly await the release of US inflation figures this week for some meaningful impetus.
Japanese Yen seems poised to appreciate further amid BoJ rate hike bets, rising trade tensions
- The Cabinet Office’s revised data released this Tuesday showed that Japan’s economic growth slowed to 2.2% on an annualized basis in the fourth quarter, lower than the initial estimate of 2.8% rise. On a quarter-to-quarter basis, the economy expanded by 0.6% as compared with a 0.7% growth in preliminary data released last month.
- The data reaffirms market bets that the Bank of Japan will keep the policy rate steady at its next policy meeting on March 18-19. That said, traders are pricing in the possibility of another BoJ rate hike as soon as May amid concerns about broadening inflation in Japan and hopes that bumper wage hikes seen last year will continue this year.
- BoJ Deputy Governor Shinichi Uchida signaled last week that the central bank was likely to raise interest rates at a pace in line with dominant views among financial markets and economists. This had been a key factor behind the recent surge in the 10-year Japanese government bond yield to its highest level since October 2008 set on Monday.
- Japan's Economy Minister Ryosei Akazawa highlighted the importance of exchange rates moving in accordance with economic fundamentals while reaffirming that monetary policy decisions rest with the BoJ. Separately, Japan’s Finance Minister Shunichi Kato said that higher long-term interest rates could have wide-ranging effects on the economy.
- Meanwhile, Japan Trade Minister Yoji Muto said that he would continue discussing tariffs with the US and did not confirm that Japan is exempt from steel tariffs. US President Donald Trump's 25% tariffs on global steel and aluminum imports go into effect on Wednesday. Furthermore, there are other levies planned for April 2.
- The US Dollar languishes near its lowest level since November amid the growing acceptance that the Federal Reserve will start its rate-cutting cycle sooner amid signs of a weakening US labor market. This, along with the uncertainty over Trump's trade policies and their impact on the US economic growth, backs the case for further monetary easing.
- Traders now look forward to the Job Openings and Labor Turnover Survey (JOLTS) for some impetus later during the North American session. The focus, however, will remain glued to the latest US consumer inflation figures on Wednesday, which will influence the USD price dynamics and determine the near-term trajectory for the USD/JPY pair.
USD/JPY bears have the upper hand while below the 148.70-148.60 pivotal support breakpoint
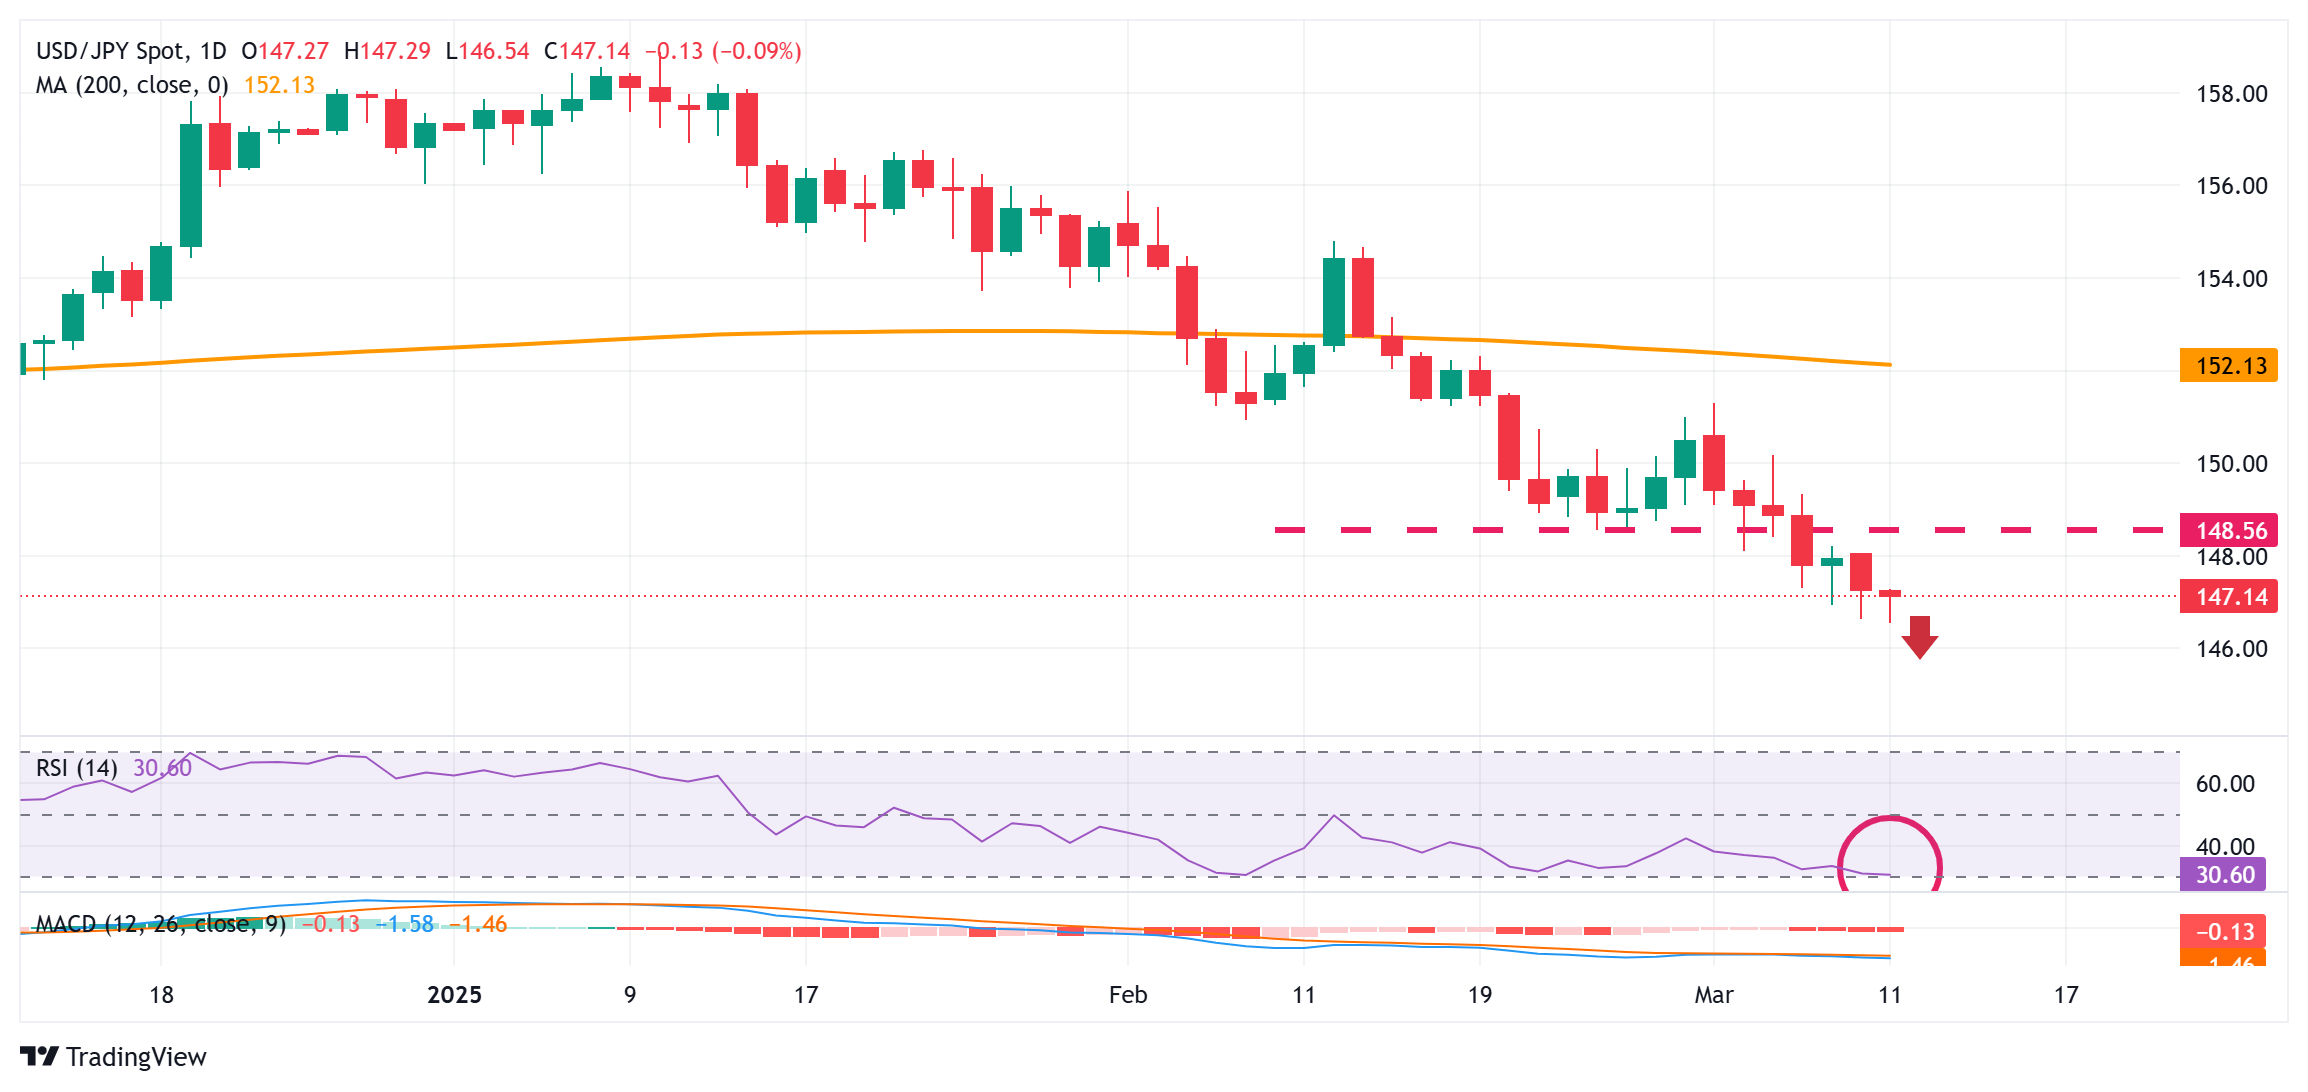
From a technical perspective, the Relative Strength Index (RSI) on the daily chart remains on the verge of breaking into the oversold territory and warrants some caution for bearish traders. Hence, it will be prudent to wait for some near-term consolidation or a modest bounce before positioning for an extension of a two-month-old downtrend. However, any attempted recovery beyond the 147.25-147.30 immediate hurdle is likely to attract fresh sellers ahead of the 148.00 round figure. This is followed by the 148.60-148.70 strong horizontal support breakpoint, now turned resistance, which should now act as a key pivotal point and cap the USD/JPY pair.
On the flip side, the Asian session swing low, around the 146.55-146.50 area, could offer some support, below which the USD/JPY pair could accelerate the slide towards the 146.00 mark. The downward trajectory could extend further towards the 145.25 intermediate support en route to the 145.00 psychological mark.
US Dollar PRICE This month
The table below shows the percentage change of US Dollar (USD) against listed major currencies this month. US Dollar was the strongest against the Canadian Dollar.
| USD | EUR | GBP | JPY | CAD | AUD | NZD | CHF | |
|---|---|---|---|---|---|---|---|---|
| USD | -4.19% | -2.20% | -1.63% | -0.08% | -0.55% | -0.89% | -2.15% | |
| EUR | 4.19% | 2.08% | 2.67% | 4.30% | 3.80% | 3.44% | 2.13% | |
| GBP | 2.20% | -2.08% | 0.55% | 2.17% | 1.68% | 1.33% | 0.04% | |
| JPY | 1.63% | -2.67% | -0.55% | 1.60% | 1.10% | 0.75% | -0.52% | |
| CAD | 0.08% | -4.30% | -2.17% | -1.60% | -0.49% | -0.82% | -2.08% | |
| AUD | 0.55% | -3.80% | -1.68% | -1.10% | 0.49% | -0.35% | -1.62% | |
| NZD | 0.89% | -3.44% | -1.33% | -0.75% | 0.82% | 0.35% | -1.27% | |
| CHF | 2.15% | -2.13% | -0.04% | 0.52% | 2.08% | 1.62% | 1.27% |
The heat map shows percentage changes of major currencies against each other. The base currency is picked from the left column, while the quote currency is picked from the top row. For example, if you pick the US Dollar from the left column and move along the horizontal line to the Japanese Yen, the percentage change displayed in the box will represent USD (base)/JPY (quote).
Forex News
Keep up with the financial markets, know what's happening and what is affecting the markets with our latest market updates. Analyze market movers, trends and build your trading strategies accordingly.