-
Opps!
This language contents are not available!

GBP/CAD Price Prediction: Breaking out of Rising Wedge and falling
- GBP/CAD is breaking out of its Rising Wedge pattern and declining.
- It will probably continue towards the pattern’s downside targets.
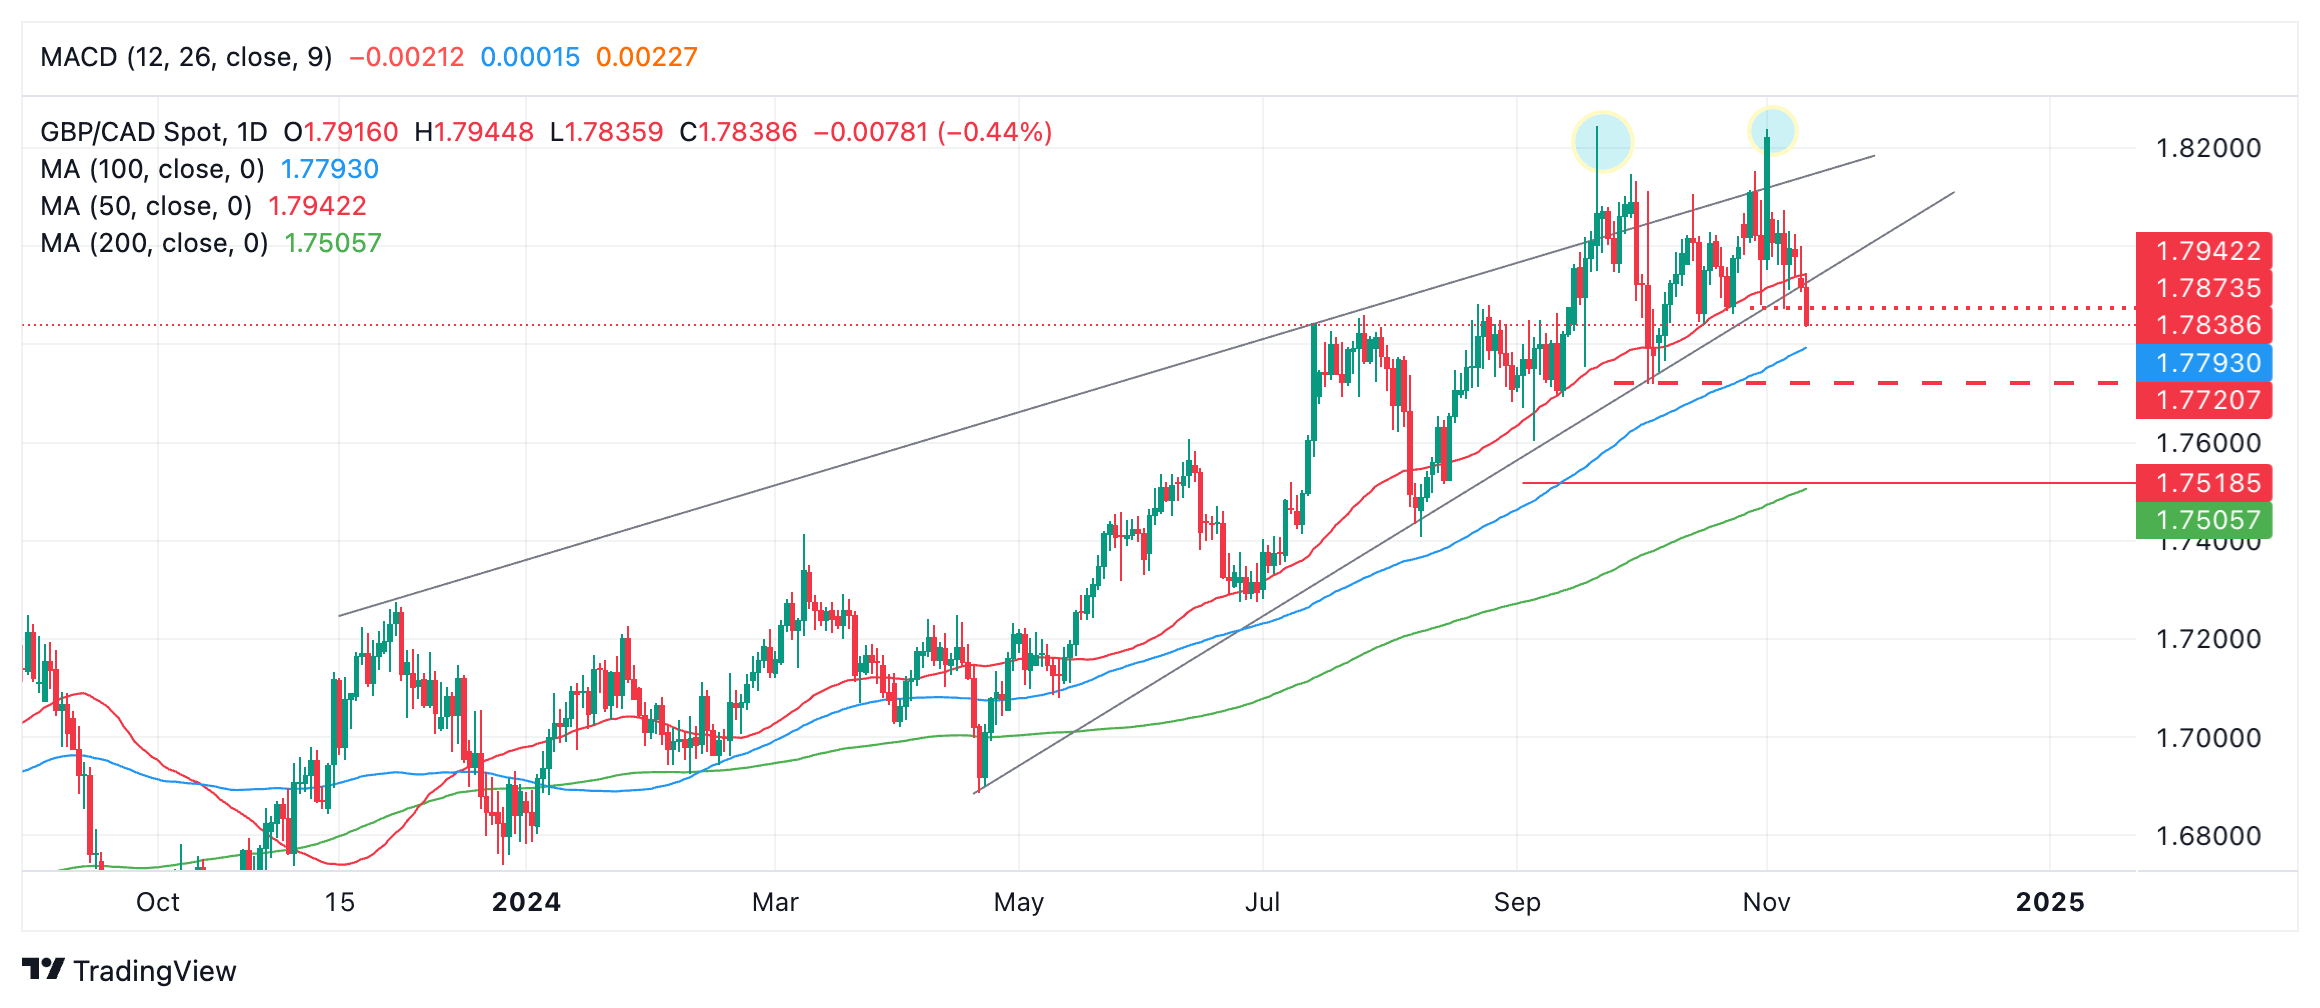
GBP/CAD is breaking decisively out of a Rising Wedge pattern and declining quite quickly.
GBP/CAD Daily Chart
It has breached the 1.7871, November 6 low, indicating a probable confirmed breakout. The next target to the downside is 1.7719, the October 3 swing low.
A break below that would probably initiate further weakness to the next target at 1.7518, the 61.8% extrapolation of the width of the Rising Wedge at its widest part extrapolated lower. This is the usual technical method for forecasting breakouts.
GBP/CAD broke temporarily above the upper guardrail of the Rising Wedge pattern on several occasions (blue circles on chart) on September 20 and November 1. This is a sign of bullish exhaustion and an early warning of impending reversal.
Forex News
Keep up with the financial markets, know what's happening and what is affecting the markets with our latest market updates. Analyze market movers, trends and build your trading strategies accordingly.


