Gold price slides to fresh daily low, further below $2,700 amid notable USD strength
- Gold price met with a fresh supply and eroded a part of the overnight recovery gains.
- The Trump trade optimism revives the USD demand and weighs on the precious metal.
- Retreating US bond yields and bets for additional Fed rate cuts could help limit losses.
Gold price (XAU/USD) remains depressed below the $2,700 mark heading into the European session on Friday amid a modest US Dollar (USD) strength, bolstered by hope that Trump's policies would spur economic growth and inflation. Apart from this, a generally positive risk tone undermines the safe-haven precious metal, which, for now, seems to have stalled its goodish recovery move from the 50-day Simple Moving Average (SMA) support, or over a three-week low touched on Thursday.
Meanwhile, the unwinding of the so-called Trump trade and the lack of hawkish signals from the Federal Reserve (Fed) keep the US Treasury bond yields below a multi-month peak. This might hold back the US bulls from placing aggressive bets and limit losses for the non-yielding Gold price. Nevertheless, the XAU/USD remains on track to end in the red for the second straight week as traders now look to the Preliminary Michigan Consumer Sentiment Index for short-term impetuses.
Gold price remains depressed modest USD strength, positive risk tone
- Traders closed out some profitable Trump trades, which triggered a US Dollar corrective decline from a four-month high and provided a goodish lift to the Gold price on Thursday.
- The USD decline remained uninterrupted after the Federal Reserve decided to lower its benchmark overnight borrowing rate by a 25 basis point, to a target range of 4.50%-4.75%.
- In the accompanying policy statement, Fed officials justified the easing mode as they view supporting employment becoming at least as much of a priority as arresting inflation.
- Furthermore, Fed Chair Jerome Powell, during the post-meeting press conference, failed to offer cues that the central bank may pause rate cuts in the near term amid sticky inflation.
- According to the CME Group's FedWatch Tool, traders are pricing in 75% odds the Fed will cut rates again in December, leading to a further decline in the US Treasury bond yields.
- Donald Trump's presidential election victory fueled speculations about economic policy shifts that could increase deficits and inflation, and restrict the Fed's ability to cut rates.
- Meanwhile, hopes for an announcement of additional stimulus from China after a five-day meeting of the Standing Committee of the NPC remains supportive of the upbeat mood.
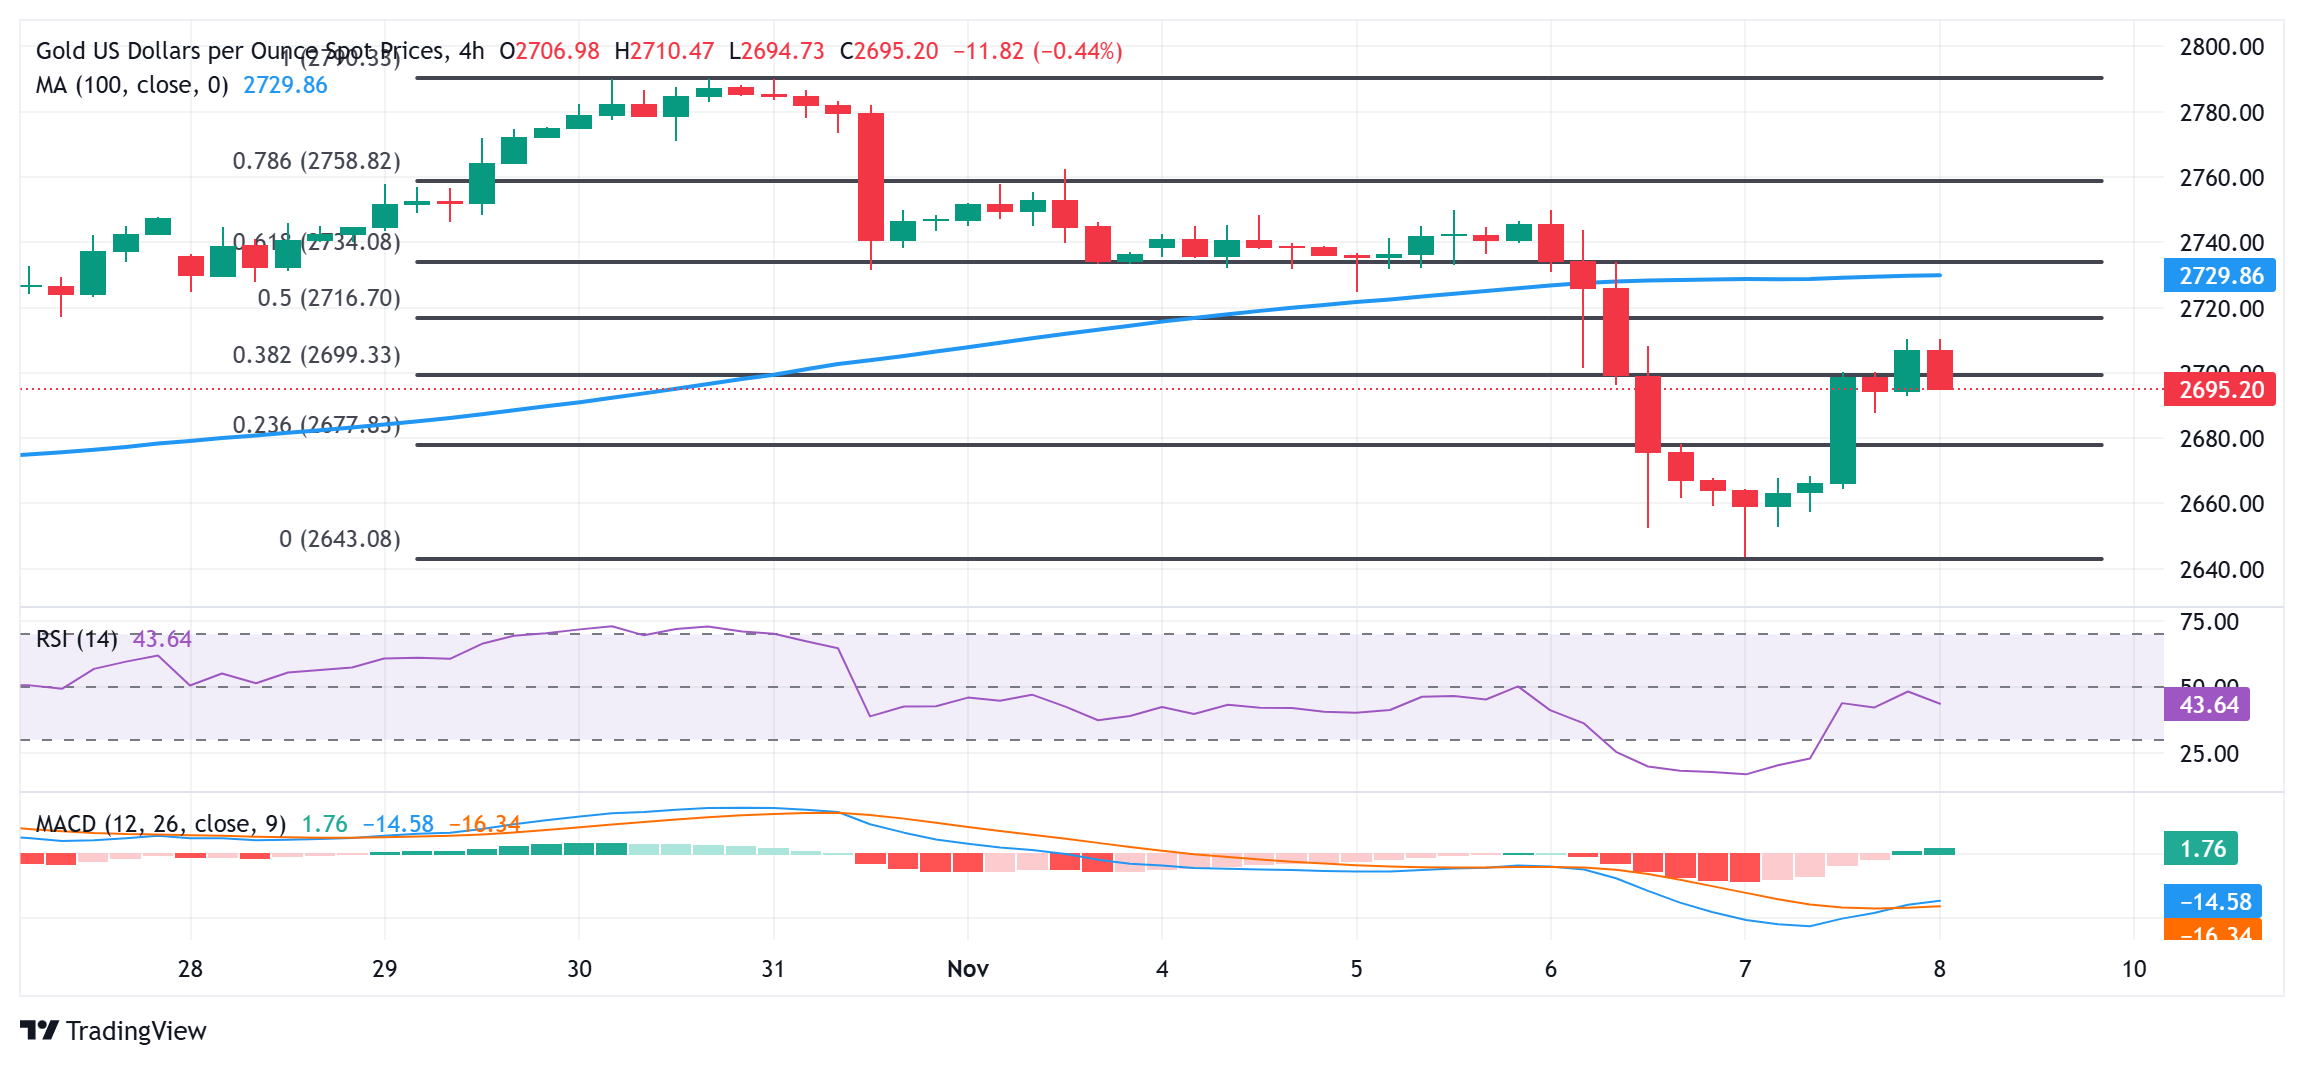
Technical Outlook: Gold price seems vulnerable while below the $2,734-2,735 supply zone
From a technical perspective, the recovery momentum falters ahead of a resistance marked by the 50% Fibonacci retracement level of the recent slide from the all-time peak. The said barrier is pegged near the $2,718 region, above which the Gold price could climb to the $2,734 area (61.8% Fibo. level). Some follow-through buying will suggest that the corrective pullback has run its course and lift the XAU/USD beyond the $2,750 static resistance en route to the $2,758-2,790 zone, or the record high touched on October 31.
On the flip side, the $2,672 region now seems to protect the immediate downside ahead of the $2,660 zone and the overnight swing low, around the $2,643 area, or the 50-day SMA support. A convincing break below the latter will be seen as a fresh trigger for bearish traders. Given that oscillators on the daily chart have been losing positive traction, the Gold price might then accelerate the fall toward the October monthly swing low, around the $2,605-2,602 region.
US Dollar PRICE Today
The table below shows the percentage change of US Dollar (USD) against listed major currencies today. US Dollar was the strongest against the Australian Dollar.
| USD | EUR | GBP | JPY | CAD | AUD | NZD | CHF | |
|---|---|---|---|---|---|---|---|---|
| USD | 0.24% | 0.12% | -0.02% | 0.19% | 0.42% | 0.31% | 0.16% | |
| EUR | -0.24% | -0.12% | -0.21% | -0.06% | 0.18% | 0.07% | -0.09% | |
| GBP | -0.12% | 0.12% | -0.10% | 0.07% | 0.30% | 0.18% | 0.03% | |
| JPY | 0.02% | 0.21% | 0.10% | 0.20% | 0.42% | 0.31% | 0.16% | |
| CAD | -0.19% | 0.06% | -0.07% | -0.20% | 0.23% | 0.13% | -0.03% | |
| AUD | -0.42% | -0.18% | -0.30% | -0.42% | -0.23% | -0.11% | -0.26% | |
| NZD | -0.31% | -0.07% | -0.18% | -0.31% | -0.13% | 0.11% | -0.16% | |
| CHF | -0.16% | 0.09% | -0.03% | -0.16% | 0.03% | 0.26% | 0.16% |
The heat map shows percentage changes of major currencies against each other. The base currency is picked from the left column, while the quote currency is picked from the top row. For example, if you pick the US Dollar from the left column and move along the horizontal line to the Japanese Yen, the percentage change displayed in the box will represent USD (base)/JPY (quote).
Forex News
Keep up with the financial markets, know what's happening and what is affecting the markets with our latest market updates. Analyze market movers, trends and build your trading strategies accordingly.

