USD/CHF Price Prediction: Extends uptrend towards 100-day SMA
- USD/CHF is closing in on the key 100-day SMA, where it will probably encounter resistance.
- The pair is in an established short and medium-term uptrend and the odds favor more upside to come.
USD/CHF extends its uptrend from the late September lows and approaches resistance at the 100-day Simple Moving Average (SMA), currently situated at 0.8697.
USD/CHF Daily Chart
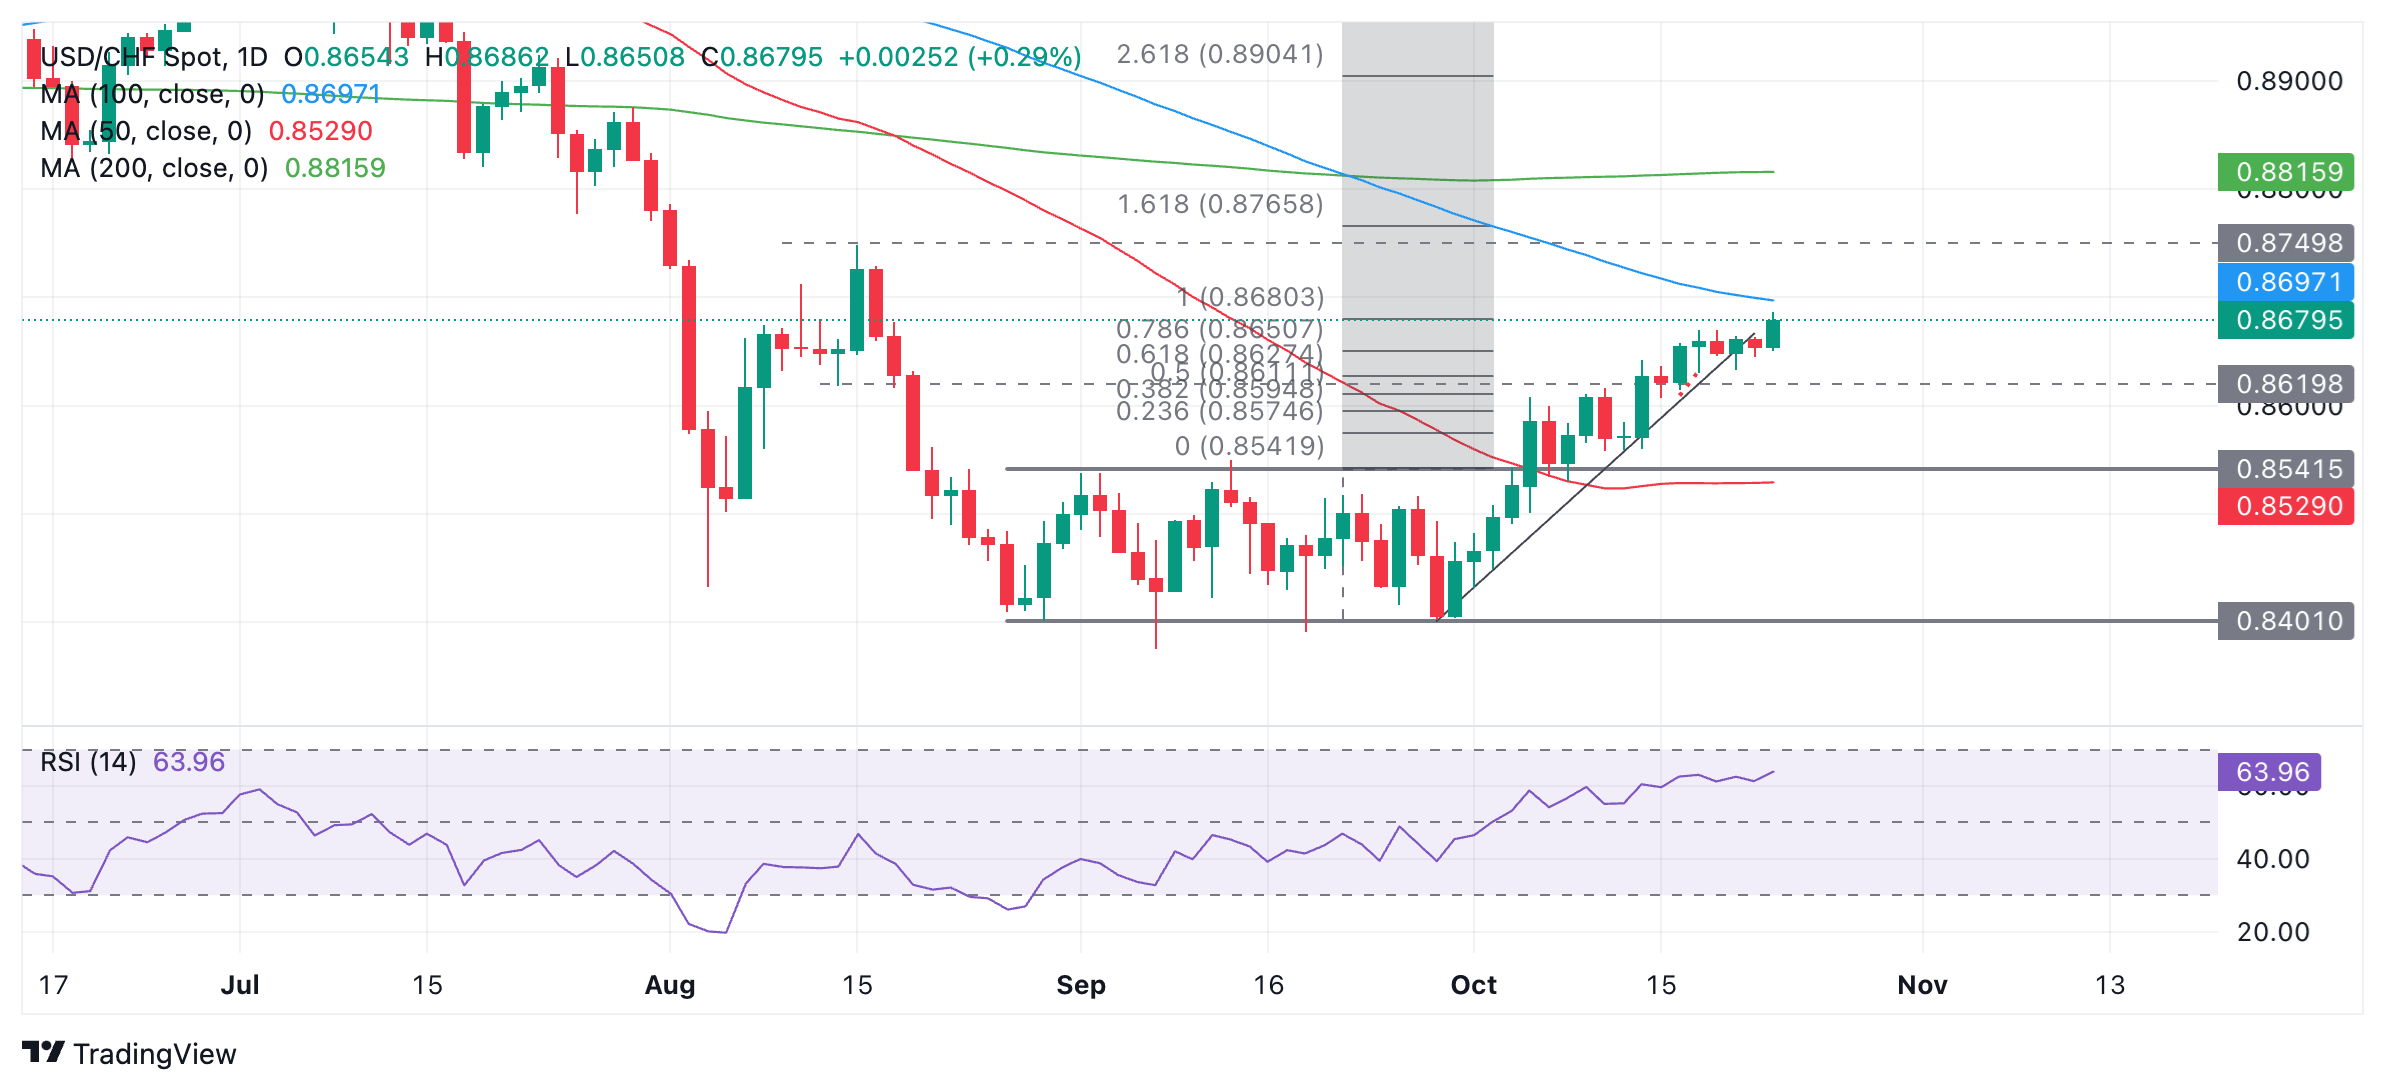
USD/CHF has now reached the target generated after it broke out of its September range, at 0.8680 – the 100% Fibonacci (Fib) extrapolation of the height of the range higher. This could signify that bullish pressure will lessen.
A break above the 100-day SMA and the 0.8700 level could lead to a further extension to the 0.8750 resistance level (August 15 high).
USD/CHF’s short and medium-term trends are bullish but its longer-term trend is probably still bearish despite the recent strong recovery.
Forex News
Keep up with the financial markets, know what's happening and what is affecting the markets with our latest market updates. Analyze market movers, trends and build your trading strategies accordingly.