EUR/USD gains further after slighter higher US Initial Jobless Claims
- EUR/USD gains as the US Dollar declines even though US President Trump continues to threaten to impose tariffs globally.
- The FOMC Minutes showed on Wednesday that officials are concerned over upside risks to inflation.
- ECB’s Schnabel expected the central bank to pause the policy-easing cycle.
EUR/USD rises to near 1.0450 as the US Dollar (USD) declines in Thursday’s North American session. The US Dollar Index (DXY), which tracks the Greenback’s value against six major currencies, falls to near 106.90. The Greenback appears to have resumed its downside journey after a mild recovery earlier this week despite United States (US) President Donald Trump’s tariffs agenda continuing to keep investors on their toes.
Till now, President Trump has imposed 25% tariffs on steel and aluminum, 10% on all imports from China, and has threatened to introduce reciprocal tariffs, with a 25% levy on automobiles, semiconductors, and pharmaceuticals by April. Donald Trump has mentioned that he refrained from imposing tariffs immediately to allow local manufacturers enough time to increase their operating capacity.
Meanwhile, slightly higher Initial Jobless Claims data for the week ending February 14 has also weighed on the US Dollar. Individuals claiming jobless benefits for the first time came in higher at 219K than estimates of 215K.
On the monetary policy front, Federal Open Market Committee (FOMC) minutes for the January meeting showed on Wednesday that policymakers hesitated to continue easing the monetary policy amid concerns over a sticky inflation outlook.
The FOMC Minutes revealed that producers will pass on the import tariff cost to consumers, according to the output policymakers have received from business owners. Such a scenario will increase inflationary pressures and allow the Fed to maintain a restrictive monetary policy stance for longer. Technically, hawkish FOMC Minutes should have supported the US Dollar, but Trump’s economic policies are driving the asset.
US Dollar PRICE Today
The table below shows the percentage change of US Dollar (USD) against listed major currencies today. US Dollar was the strongest against the Canadian Dollar.
| USD | EUR | GBP | JPY | CAD | AUD | NZD | CHF | |
|---|---|---|---|---|---|---|---|---|
| USD | -0.23% | -0.21% | -0.86% | -0.15% | -0.44% | -0.55% | -0.19% | |
| EUR | 0.23% | 0.02% | -0.66% | 0.08% | -0.21% | -0.32% | 0.02% | |
| GBP | 0.21% | -0.02% | -0.64% | 0.06% | -0.23% | -0.34% | 0.02% | |
| JPY | 0.86% | 0.66% | 0.64% | 0.72% | 0.43% | 0.27% | 0.67% | |
| CAD | 0.15% | -0.08% | -0.06% | -0.72% | -0.28% | -0.40% | -0.04% | |
| AUD | 0.44% | 0.21% | 0.23% | -0.43% | 0.28% | -0.11% | 0.23% | |
| NZD | 0.55% | 0.32% | 0.34% | -0.27% | 0.40% | 0.11% | 0.37% | |
| CHF | 0.19% | -0.02% | -0.02% | -0.67% | 0.04% | -0.23% | -0.37% |
The heat map shows percentage changes of major currencies against each other. The base currency is picked from the left column, while the quote currency is picked from the top row. For example, if you pick the US Dollar from the left column and move along the horizontal line to the Japanese Yen, the percentage change displayed in the box will represent USD (base)/JPY (quote).
Daily digest market movers: EUR/USD gains at US Dollar's expense
- EUR/USD trades higher amid weakness in the US Dollar. The Euro (EUR) is underperforming against other peers as traders have fully priced in three more interest rate cuts by the European Central Bank (ECB) by this summer. However, ECB executive board member Isabel Schnabel said on Wednesday that she expects the central bank could announce a "halt" in the monetary expansion cycle as risks to inflation have "skewed to the upside" while borrowing costs had eased a lot. Schnabel warned that domestic inflation was "still high" and wage growth was "still elevated", amid "new shocks to energy prices".
- On the geopolitical front, growing optimism over the Russia-Ukraine truce could support the Euro. President Trump has agreed to hold more talks with Russia, including Ukraine and Europe, to end the war in Ukraine. A Russia-Ukraine peace agreement would have a favorable impact on the Eurozone. The truce would improve the global supply chain and lower energy prices. The Eurozone used to be significantly dependent on Russia for energy imports before its war with Ukraine.
- Going forward, the major trigger for the US Dollar and the Euro (EUR) will be flash Purchasing Managers Index (PMI) data for February, which will be released on Friday.
Technical Analysis: EUR/USD strives to hold key 50-day EMA
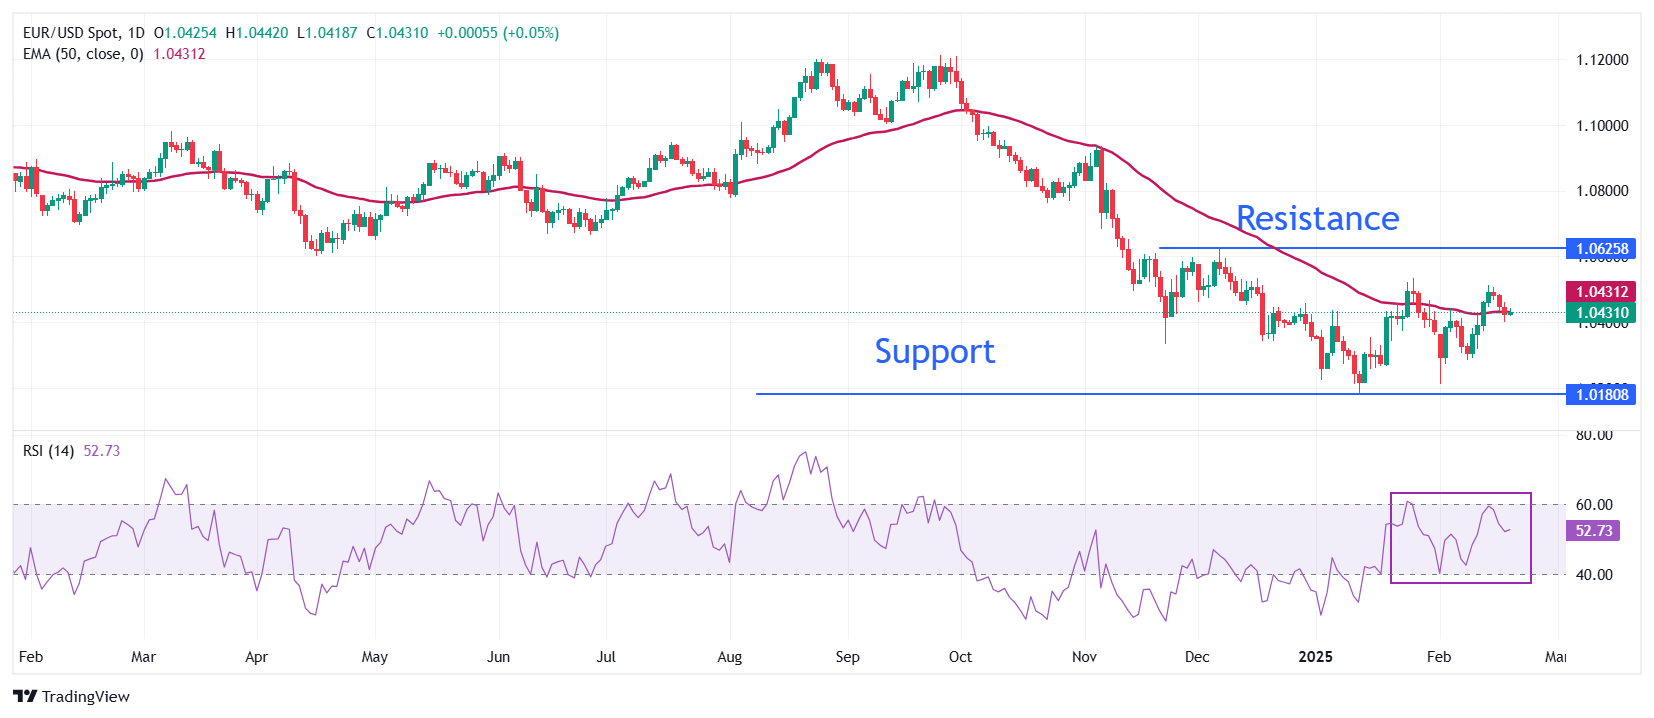
EUR/USD trades inside Wednesday’s trading range around 1.0440 in North American trading hours on Thursday. The 50-day Exponential Moving Average (EMA) continues to offer support to the major currency pair around 1.0430.
The 14-day Relative Strength Index (RSI) struggles to break above 60.00. A bullish momentum would activate if the RSI (14) manages to sustain above that level.
Looking down, the February 10 low of 1.0285 will act as the major support zone for the pair. Conversely, the December 6 high of 1.0630 will be the key barrier for the Euro bulls.
Forex News
Keep up with the financial markets, know what's happening and what is affecting the markets with our latest market updates. Analyze market movers, trends and build your trading strategies accordingly.