GBP/JPY Price Forecast: Decisively breaks out of Triangle pattern, upside target awaits
- GBP/JPY has broken out of the top of a Right-Angle Triangle and moved some of the distance towards its target.
- The pair will probably go higher, subject to confirmation.
GBP/JPY has broken out of a Right-Angle Triangle pattern and rallied higher.
The pair completed a decisive move above the upper boundary of a Triangle pattern (see chart) and peaked on Wednesday at 198.44.
The first upside target for the pattern lies at 199.59 (blue shaded rectangle), the 61.8% Fibonacci extrapolation of the height of the triangle (at its widest point) higher.
GBP/JPY Daily Chart
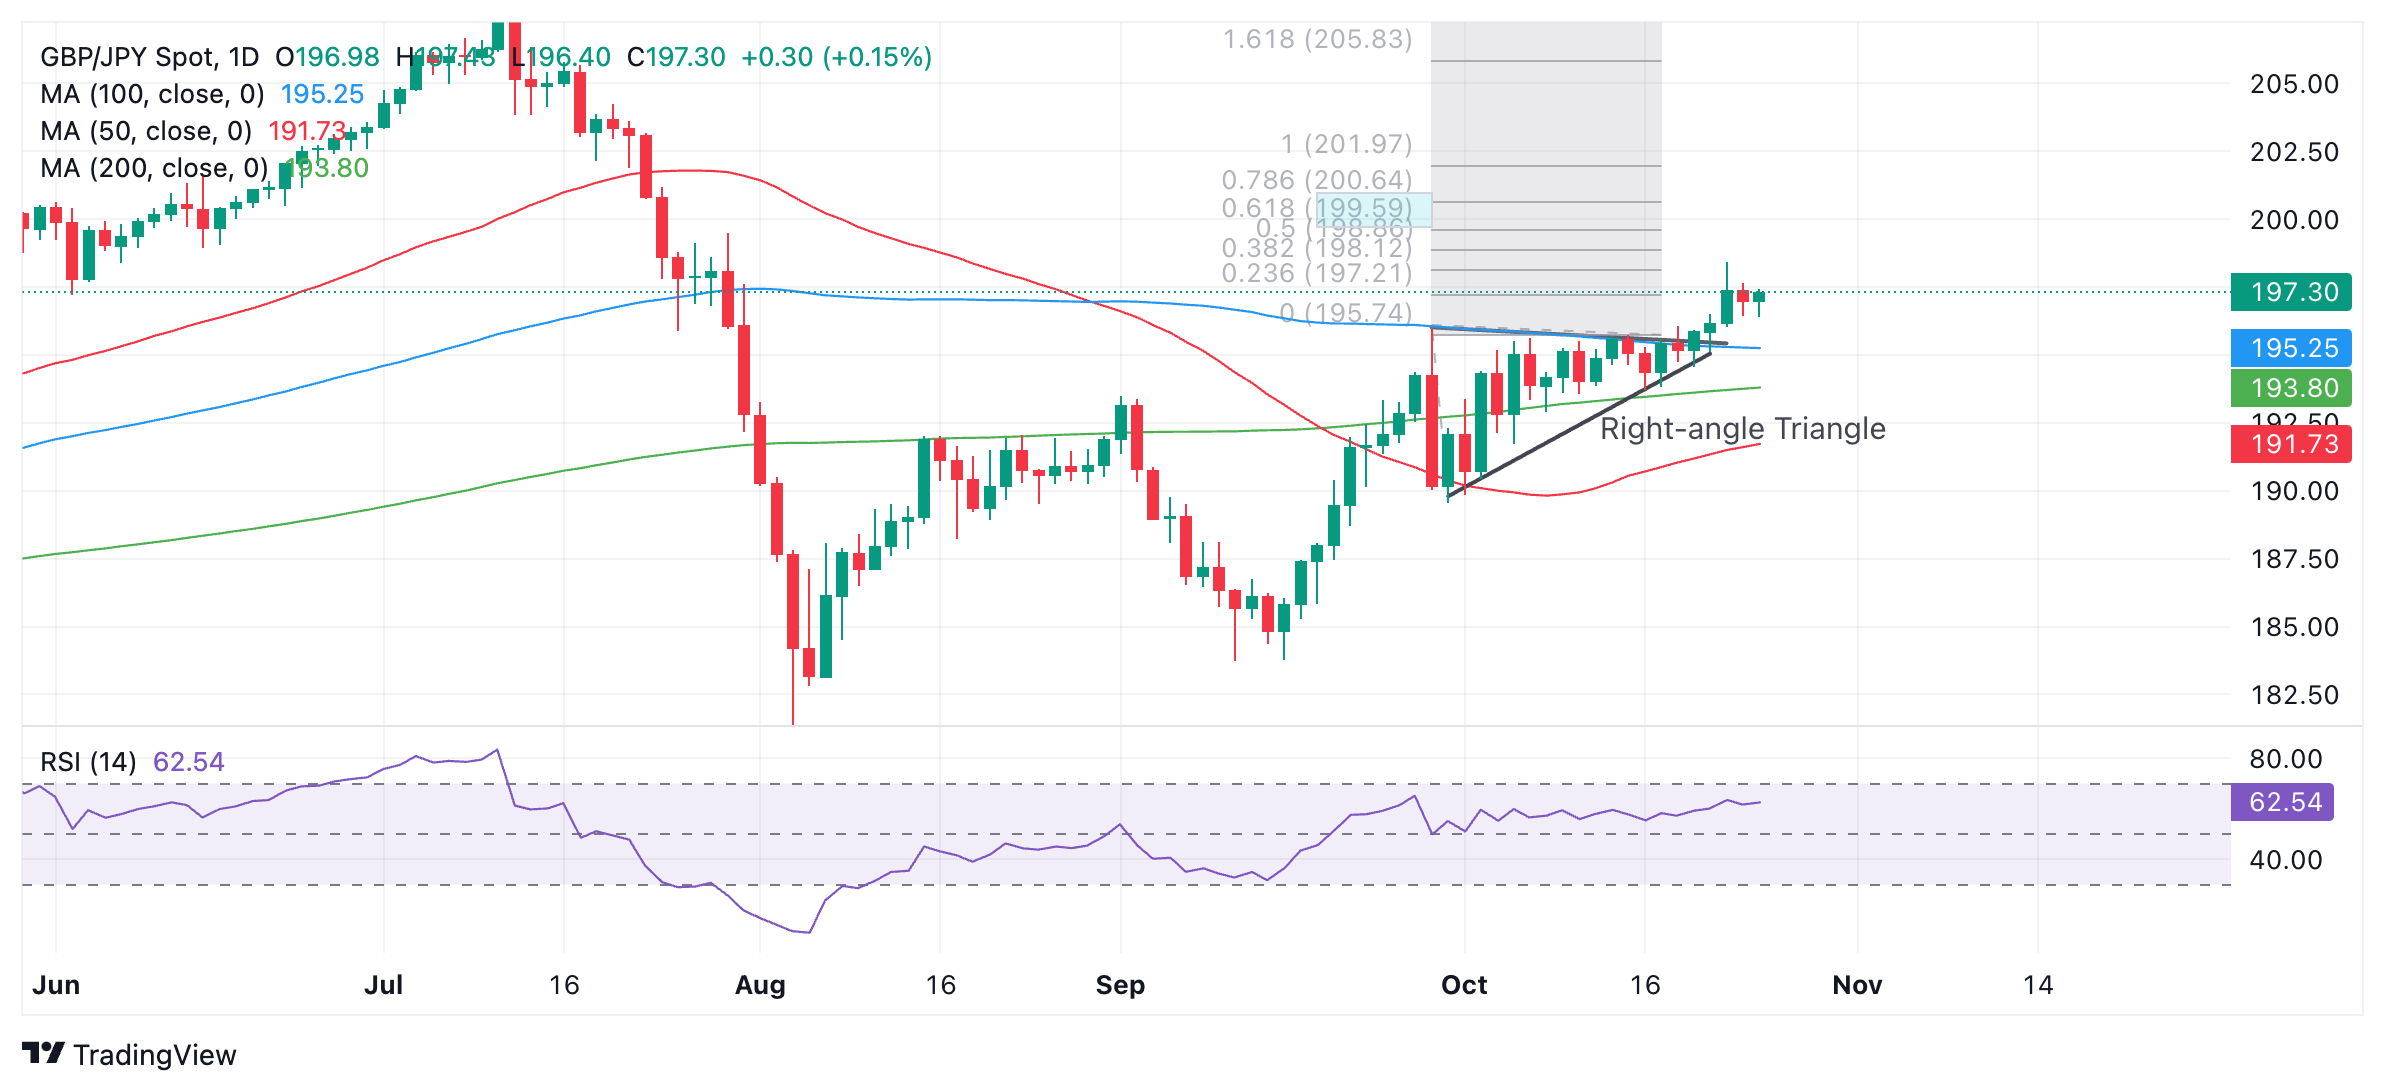
The pair has pulled back since peaking but the odds favor it eventually rallying back up to the aforementioned target. A break above Wednesday’s 198.44 high would provide bullish confirmation.
The Relative Strength Index (RSI) momentum indicator is not yet in the overbought zone (above 70) suggesting the pair has room to go higher.
Forex News
Keep up with the financial markets, know what's happening and what is affecting the markets with our latest market updates. Analyze market movers, trends and build your trading strategies accordingly.