GBP/USD retreats below 1.3000 after hitting 4-month high amid Fed, BoE uncertainty
- GBP/USD slips to 1.2975, down 0.12%, after touching 1.3000, its highest level in four and a half months.
- US Industrial Production was strong but was offset by weaker housing data and Trump’s renewed trade policies.
- BoE and Fed policy decisions loom, with markets pricing in rate cuts later in the year for both central banks.
The Pound Sterling (GBP) is retreating during the North American session against the US Dollar (USD) after hitting a four-and-a-half-month high at 1.3000 before trimming earlier gains. At the time of writing, the GBP/USD trades at 1.2975, down 0.12%.
Pound trims gains as traders brace for central bank decisions
Economic data continues to be overlooked as traders digest United States (US) President Donald Trump's protectionist policies aimed at reducing the trade deficit.
Earlier, US Industrial Production in February expanded 0.7% MoM, exceeding estimates of 0.2% and January’s 0.3% print, boosted by motor vehicles. Housing data was mixed, with Building Permits in February falling 1.2% from 1.473 million to 1.456 million, while Housing Starts for the same period rose 11.2% from 1.35 million to 1.501 million.
Aside from this, risk appetite deteriorates as investors brace for the Federal Reserve (Fed) monetary policy. Most economists expect the Fed to hold rates, though it is unclear whether they will adopt a dovish or hawkish stance on their forecasts in the Summary of Economic Projections (SEP).
Across the pond, the Bank of England (BoE) is also expected to keep the Bank Rate unchanged on Thursday, with market participants pricing in an 89% chance of no change. For the full year, traders expect 54 basis points (bps) of easing.
In the meantime, the Organization for Economic Cooperation and Development (OECD) updated its forecasts for the United Kingdom (UK). The OECD expects the economy to grow 1.4%, down from its December forecast of 1.7%.
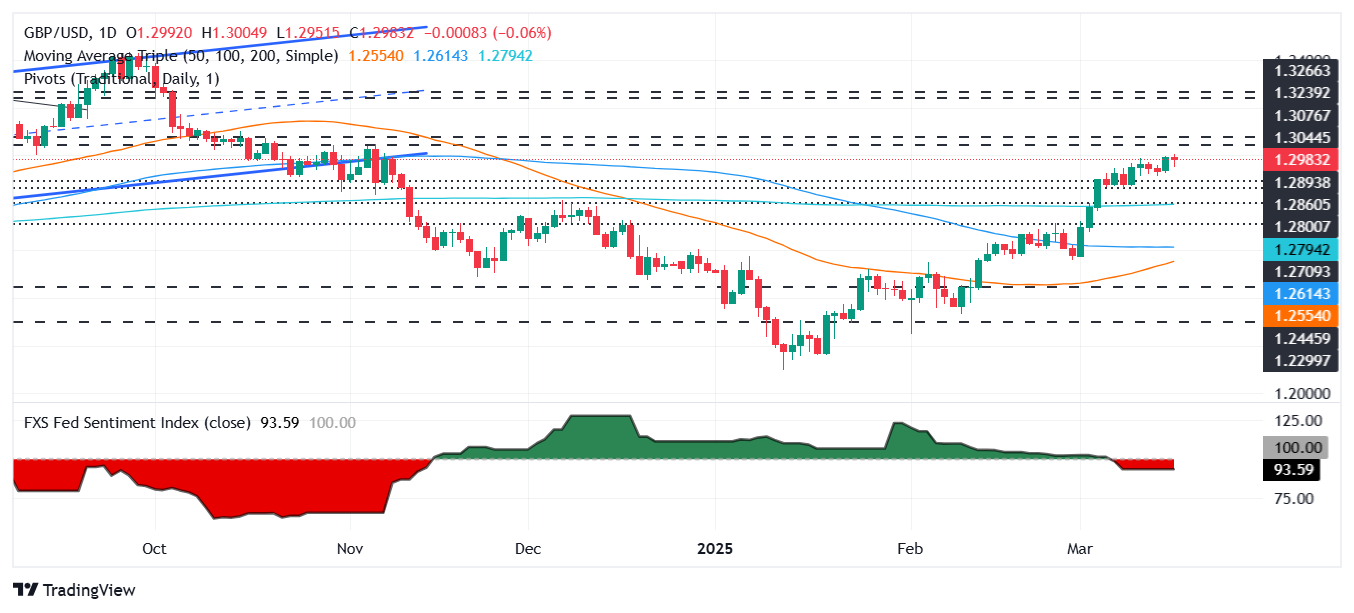
GBP/USD Price Forecast: Technical outlook
GBP/USD remains upward biased trading near the year-to-date (YTD) peaks around 1.3000, though the rally has lost some steam, with the pair consolidating around the 1.2900 – 1.3000 range. The Relative Strength Index (RSI) hovers near overbought territory, an indication that buyers lack the strength to push prices higher. Therefore, a dip is likely, with bulls expected to defend the March 17 low of 1.2911.
Conversely, a decisive breach of the 1.3000 would expose the November 6 swing high at 1.3047.
British Pound PRICE Today
The table below shows the percentage change of British Pound (GBP) against listed major currencies today. British Pound was the strongest against the Australian Dollar.
| USD | EUR | GBP | JPY | CAD | AUD | NZD | CHF | |
|---|---|---|---|---|---|---|---|---|
| USD | -0.04% | 0.08% | 0.22% | 0.15% | 0.45% | 0.17% | -0.32% | |
| EUR | 0.04% | 0.11% | 0.26% | 0.17% | 0.48% | 0.20% | -0.29% | |
| GBP | -0.08% | -0.11% | 0.14% | 0.07% | 0.37% | 0.09% | -0.42% | |
| JPY | -0.22% | -0.26% | -0.14% | -0.08% | 0.22% | -0.08% | -0.57% | |
| CAD | -0.15% | -0.17% | -0.07% | 0.08% | 0.31% | 0.03% | -0.49% | |
| AUD | -0.45% | -0.48% | -0.37% | -0.22% | -0.31% | -0.28% | -0.79% | |
| NZD | -0.17% | -0.20% | -0.09% | 0.08% | -0.03% | 0.28% | -0.51% | |
| CHF | 0.32% | 0.29% | 0.42% | 0.57% | 0.49% | 0.79% | 0.51% |
The heat map shows percentage changes of major currencies against each other. The base currency is picked from the left column, while the quote currency is picked from the top row. For example, if you pick the British Pound from the left column and move along the horizontal line to the US Dollar, the percentage change displayed in the box will represent GBP (base)/USD (quote).
Forex News
Keep up with the financial markets, know what's happening and what is affecting the markets with our latest market updates. Analyze market movers, trends and build your trading strategies accordingly.