USD/JPY remains below 154.50 amid weaker US Dollar
- USD/JPY continues to decline as the US Dollar correction exerts pressure on the pair.
- Japan's CPI data is scheduled to be released on Friday, expecting a moderation in consumer prices for March.
- US President Joe Biden calls for a tripling of tariffs on Chinese steel and aluminum.
USD/JPY extends its losses for the second successive session, trading around 154.30 during the Asian hours on Thursday. The decline in the US Dollar (USD) exerts pressure on the USD/JPY pair. The Japanese Yen (JPY) might have received support from Japan's trade balance shifting to a surplus in March.
Japan’s Merchandise Trade Balance Total improved to ¥366.5 billion surplus from the previous deficit of ¥377.8 billion. Additionally, the Japanese Yen could have strengthened due to safe-haven inflows, likely prompted by risk aversion amid heightened geopolitical tensions in the Middle East.
US President Joe Biden addressed the American steel industry hub in Pittsburgh on Wednesday, advocating for heightened pressure on the Chinese steel sector. He has urged US Trade Representative Katherine Tai to explore the possibility of tripling the existing 7.5% tariff rate on Chinese steel and aluminum, according to CBS News. This development could potentially benefit the Japanese market and provide support for the Japanese Yen (JPY).
Traders anticipate the release of Japan's National Consumer Price Index (CPI) data by the Statistics Bureau of Japan on Friday, with market expectations leaning towards a moderation in consumer prices for March.
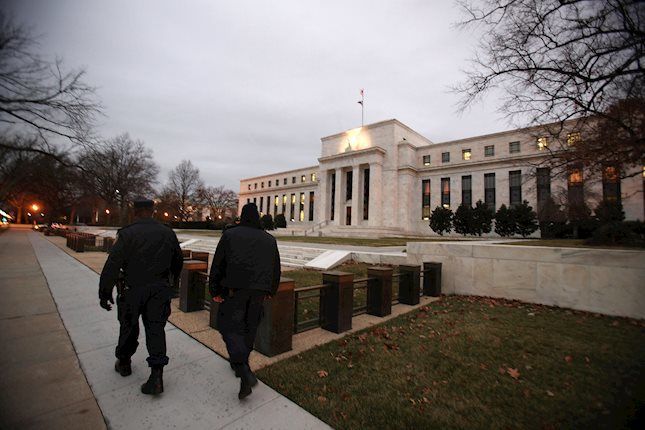
On the other hand, the expectation of the Federal Reserve (Fed) maintaining elevated interest rates for an extended period, supported by a robust US economy and persistent inflation, serves as a counterbalance to the downward pressure on the USD/JPY pair.
Federal Reserve Bank of Cleveland President Loretta Mester addressed on Wednesday, noting that inflation surpasses expectations and that the Fed requires more assurance before confirming the sustainability of 2% inflation. She added that monetary policy is well-positioned, with a potential rate cut if labor market conditions deteriorate.
Additionally, Federal Reserve (Fed) Governor Michelle Bowman remarked that progress in inflation is slowing, potentially stalling altogether. Bowman also mentioned that monetary policy is presently restrictive, and time will determine if it is adequately so.
Forex News
Keep up with the financial markets, know what's happening and what is affecting the markets with our latest market updates. Analyze market movers, trends and build your trading strategies accordingly.